U.S. Long Bond: Let’s Review the “Upward Point of Exhaustion”
Here’s an update on the trend of 30-year U.S. Treasuries since the historic early March price moves.
Back in early March, the behavior of the bond market was reminiscent of what unfolded during the depths of the 2007-2009 financial crisis.
Prices and yields were making major moves in a short period of time.
On March 5, the U.S. Treasury long bond closed at 173^30.0. The very next day, on March 6, the long bond rallied to 180^19.0, a whopping 6+point move, reaching a new all-time high.
But the rally had more to go.
On March 9, Elliott Wave International’s U.S Short Term Update, a publication which provides near-term forecasts for major U.S. financial markets three times a week, showed this chart and said:
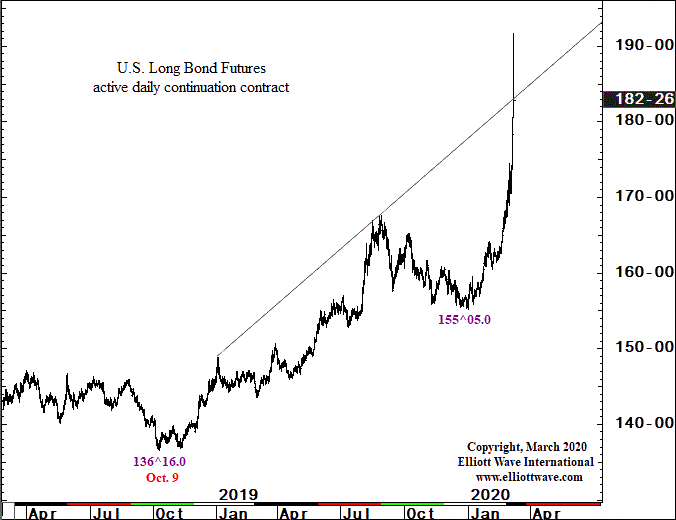
The moves in bond prices and yields are historic. The yield on 30-year US T-bonds dropped to 0.6987% intraday. At the close, 30-year yields barely had a 1% handle. The [U.S. Treasury long bond] spiked to 191^22.0 and the DSI Indicator (trade-futures.com) is at 98% bond bulls. Prices surged through the … trendline but then pulled back to close right on it. Might this be the point of upward exhaustion? In just two days, prices have rallied 21 points. Junk-to-U.S. treasury spreads have surged to 550 basis points, the widest since July 2016.
As it turned out, on that very day, U.S. long bond prices did reach “the point of upward exhaustion.”
Here’s what’s happened since. This chart is from the June 5 U.S. Short Term Update, which noted that March 9 high and said:
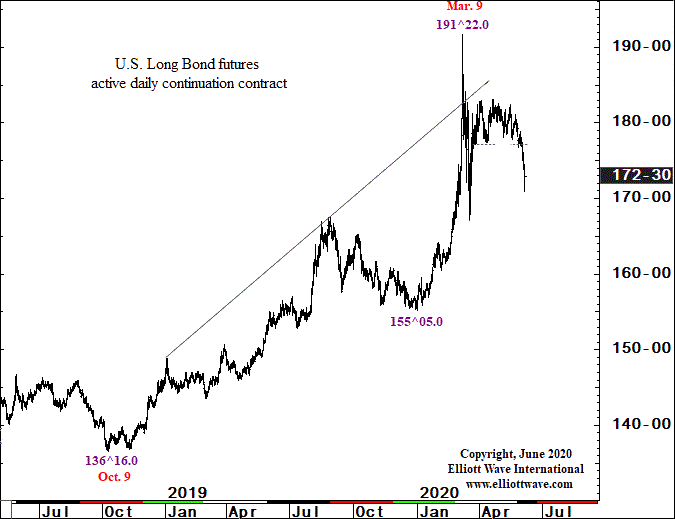
[U.S. Treasury long bond futures] are working their way down. … Market moves are never a straight line, but the decline is developing impulsively.
Many investors “diversify” into bonds to shield themselves from the volatility of the stock market.
However, market participants can lose just as big in the bond market.
The U.S. Short Term Update identifies price targets, which are in accordance with the long bond’s Elliott wave structure.
As Frost & Prechter’s Elliott Wave Principle: Key to Market Behavior notes:
It is our practice to try to determine in advance where the next move will likely take the market. One advantage of setting a target is that it gives a sort of backdrop against which to monitor the market’s actual path.
The Wave Principle can be applied to bonds, as well as stocks, gold, currencies and other widely traded markets.
If you’d like to learn more about the Wave Principle, you can access the online version of Elliott Wave Principle: Key to Market Behavior, free.
All that’s required is a free Club EWI membership. Club EWI is the largest Elliott wave educational community in the world.
Follow this link to get started: Elliott Wave Principle: Key to Market Behavior, free access.