Do These Explanations Make Sense for This Intraday Stock Market Turn?
The market “is not propelled by … external causality”
On Oct. 19, the DJIA had been trading higher for much of the morning, but by the last hour of trading, the index was more than 400 points in the red.
During that last hour of trading, a major financial website offered this explanation (CNBC):
Dow drops more than 400 points as stimulus uncertainty grows and coronavirus cases rise
Also toward the end of that day’s trading, the Wall Street Journal said:
U.S. Stocks Fall on Stimulus Worries
Well, these explanations seem to make sense. However, one must also consider that the lack of progress on another stimulus package and an increase in coronavirus cases are nothing new.
Moreover, the stock market has seen advances when bad news on either or both fronts were grabbing headlines.
For example, on August 12, Barron’s said:
The S&P 500 Closed Just Below a New High
U.S. stocks gained on Tuesday, despite the lack of progress in efforts to negotiate another stimulus package …
And, on Sept. 25, Barron’s said:
The Dow Rises Despite Virus …
Note that word, despite. Even in cases when the news clearly doesn’t fit the market action, news outlets still try to tie one to the other. You see it all the time. It’s hard to blame them, because almost everyone is conditioned to expect the news to drive the market.
But getting back to our example, it seems questionable that stimulus uncertainty or COVID-19 developments caused the DJIA’s slide on Oct. 19. Indeed, it didn’t; a change in market sentiment did.
As the Wall Street classic book, Elliott Wave Principle: Key to Market Behavior, by Frost & Prechter, says:
Sometimes the market appears to reflect outside conditions and events, but at other times it is entirely detached from what most people assume are causal conditions. The reason is that the market has a law of its own. It is not propelled by the external causality to which one becomes accustomed in the everyday experiences of life. The path of prices is not a product of news.
So, what does determine the path of market prices?
The answer is, market psychology, which unfolds according to the paths described by the Elliott Wave Principle. This illustration shows the basic design in both bull and bear markets:
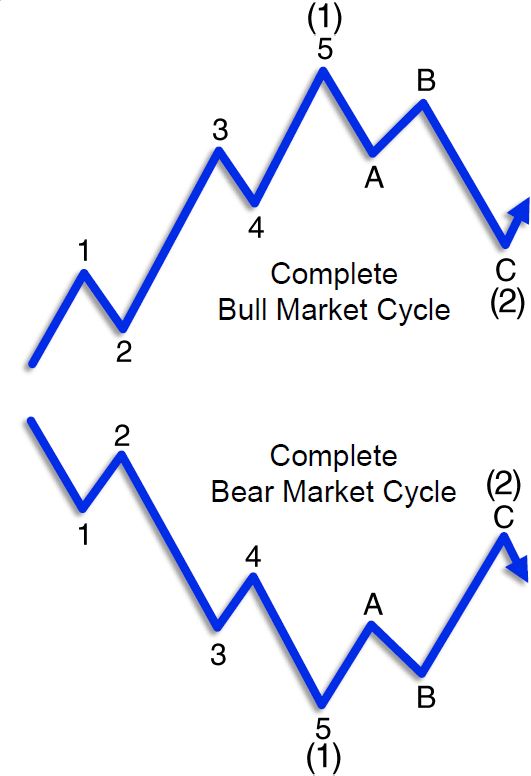
As Elliott Wave Principle: Key to Market Behavior says:
One complete cycle consisting of eight waves … is made up of two distinct phases, the five-wave motive phase … and the three-wave corrective phase. … When an initial eight-wave cycle ends, a similar cycle ensues, which is then followed by another five-wave movement.
When you look at the news to gauge what’s next for the market, you are by definition putting yourself one step behind. First, something must happen, then the market is supposed to react — and only then you can act.
By contrast, when you track wave patterns in market charts, you can see what pattern is underway now, so you can predict what pattern is next — news or no news. Now you are one step ahead!
So, look to Elliott wave analysis rather than the news for insights into the market’s next big move.
Once again, let’s return to Elliott Wave Principle: Key to Market Behavior:
It is a thrilling experience to pinpoint a turn, and the Wave Principle is the only approach that can occasionally provide the opportunity to do so.
The ability to identify such junctures is remarkable enough, but the Wave Principle is the only method of analysis that also provides guidelines for forecasting.
Learn more about how the Elliott wave model can help you navigate widely traded financial markets by reading the online version of Elliott Wave Principle: Key to Market Behavior for free.
Follow this link to get started: Elliott Wave Principle: Key to Market Behavior — unlimited, free access.