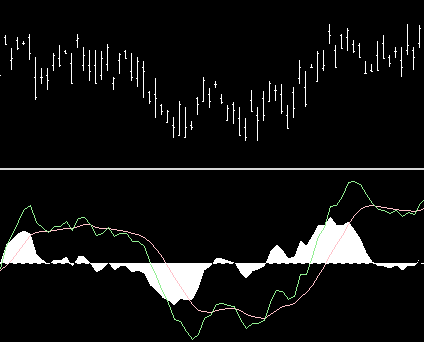
MACD Buy Sell Signals
MACD 12,26,9 |
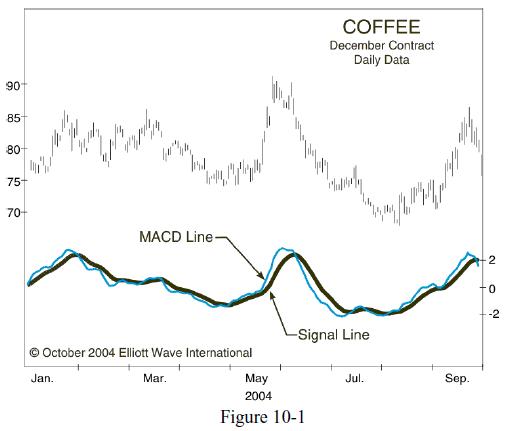
MACD, which stands for Moving Average Convergence / Divergence, is a technical analysis indicator created by Gerard Appel in the 1960s. It shows the difference between a fast and slow exponential moving average (EMA) of closing prices. Fast means a short-period average, and slow means a long period one, the standard periods are 12 and 26 days,
A signal or trigger line is then formed by smoothing this with a further EMA. The standard period for this is 9 days,
recommended looking at a MACD on a weekly scale before looking at a daily scale, so as to avoid making short term trades against the direction of the intermediate trend.
The difference between the MACD and the signal line is often calculated and shown not as a line, but a solid block histogram style. This construction was made by Thomas Aspray in 1986. The calculation is simply
The set of periods for the averages, often written as say 12,26,9, can be varied. Appel and others have experimented with various combinations. Interpretation MACD is a trend following indicator, and is designed to identify trend changes. It’s generally not recommended for use in ranging market conditions. Three types of trading signals are generated,
The purpose of the histogram is to help show when a crossing occurs, since when it crosses through zero the MACD crosses the signal line. The histogram can also help visualizing when the two lines are coming together. Both may still be rising, but coming together, so a falling histogram suggests a crossover may be approaching. A crossing of the MACD line up through zero is interpreted as bullish, or down through zero as bearish. These crossings are of course simply the original EMA(12) line crossing up or down through the slower EMA(26) line. Positive divergence between MACD and price arises when price makes a new selloff low, but the MACD doesn’t make a new low, ie. it remains above where it fell to on that previous price low. This is interpreted as bullish, suggesting the downtrend may be nearly over. Negative divergence is the same thing when rising, ie. price makes a new rally high, but MACD doesn’t rise as high as it did before; this is interpreted as bearish. Divergence may be similarly interpreted on the price versus the histogram, ie. new price levels not confirmed by new histogram levels. Longer and sharper divergence (distinct peaks or troughs) are regarded as more significant than small shallow patterns in this case. John Murphy (in Technical Analysis of the Financial Markets) also recommended looking at a MACD on a weekly scale before looking at a daily scale, so as to avoid making short term trades against the direction of the intermediate trend.
|
||||||
| Trading using technical indicators — such as the MACD, for example — can do one of two things: help you or hurt you.
Elliott Wave International’s Jeffrey Kennedy explains what he loves and hates about technical indicators and shows you how he uses them to his advantage in this excerpt from his FREE eBook, The Commodity Trader’s Classroom. I love a good love-hate relationship, and that’s what I’ve got with technical indicators. Technical indicators are those fancy computerized studies that you frequently see at the bottom of price charts that are supposed to tell you what the market is going to do next (as if they really could). The most common studies include MACD, Stochastics, RSI, and ADX, just to name a few. The No. 1 (and Only) Reason to Hate Technical Indicators Have you ever been to a magic show? Isn’t amazing how magicians pull rabbits out of hats and make all those things disappear? Of course, the “amazing” is only possible because you’re looking at one hand when you should be watching the other. Magicians succeed at performing their tricks to the extent that they succeed at diverting your attention. That’s why I hate technical indicators; they divert my attention the same way magicians do. Nevertheless, I have found a way to live with them, and I do use them. Here’s how: Rather than using technical indicators as a means to gauge momentum or pick tops and bottoms, I use them to identify potential trade setups. Three Reasons to Learn to Love Technical Indicators
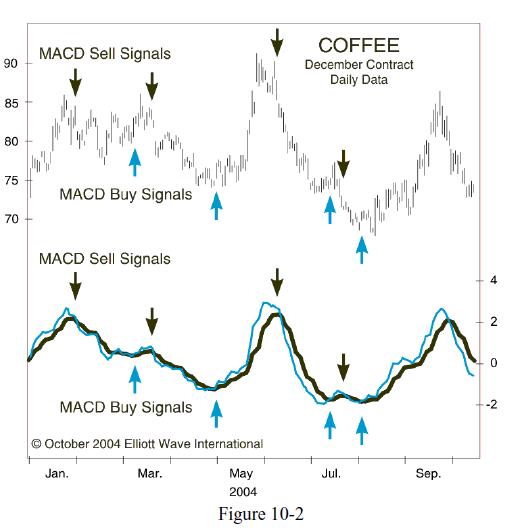
The simplest trading rule for MACD is to buy when the MACD line (the thin line) crosses above the Signal line (the thick line), and sell when the MACD line crosses below the Signal line. Some charting systems (like Genesis or CQG) may refer to the MACD line as MACD and the Signal line as MACDA. Figure 10-2 (Coffee) highlights the buy-and-sell signals generated from this very basic interpretation.
Although many people use MACD this way, I choose not to, primarily because MACD is a trend-following or momentum indicator. An indicator that follows trends in a sideways market (which some say is the state of markets 80% of the time) will get you killed. For that reason, I like to focus on different information that I’ve observed and named: Hooks, Slingshots and Zero-Line Reversals. Once I explain these, you’ll understand why I’ve learned to love technical indicators.
|
||||||