Stock Market: Why You Should Prepare for a Jump in Volatility
This volatility indicator “has made a series of higher lows” — and it’s not a good sign.
Stock market volatility is like a roller-coaster ride — extreme ups and downs.
However, unlike thrill-seeking roller-coaster riders who often rise from their seats after the ride with a smile, investors often exit with a frown.
That’s because extreme volatility after a stock rally often ends with prices much lower.
Having said that, many investors — even professionals — do not anticipate a jump in volatility right now.
Indeed, the San Diego Union-Tribune asked the senior principal of a financial advisory firm on Jan. 15:
Will 2021 be a volatile year for the stock market?
He replied:
NO: If 2020 had not been a volatile stock year — what with the pandemic, recession, elections, and riots — then it is reasonable to expect that 2021 should be relatively stable.
Yet, a key stock market indicator is revealing.
Here are insights from the Jan. 15 U.S. Short Term Update, a thrice weekly Elliott Wave International publication which provides near-term forecasts for major U.S. financial markets:
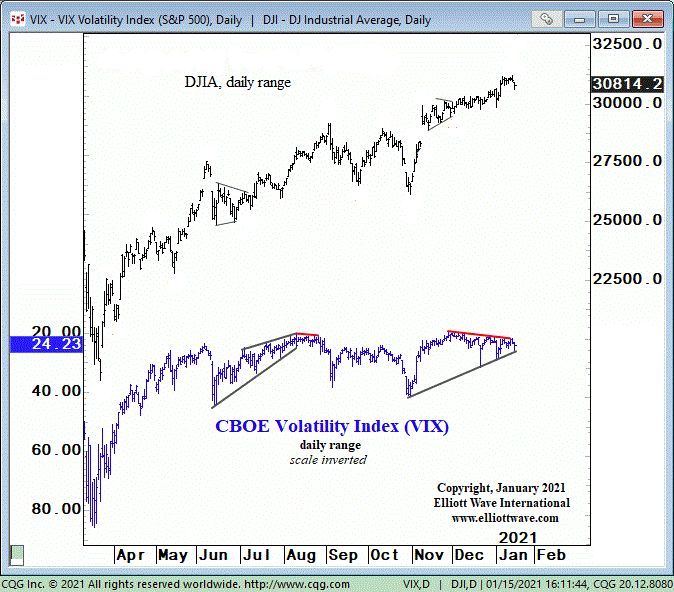
The chart shows the DJIA in the top graph and the CBOE Volatility Index (VIX) in the bottom graph. We’ve inverted the scale of the VIX so it aligns with stock prices. This index measures investors’ expectations for market volatility for the coming 30 days. Most of the time, the VIX trends and reverses with stocks. When the behavior changes, it’s time to watch both stocks and the VIX closely. The most recent intraday low in the VIX occurred at 19.51 on November 27. Since then, the DJIA has made a series of higher highs while the VIX has made a series of higher lows. This divergence is denoted with a red trendline on the chart.
The Jan. 15 U.S. Short Term Update goes on to describe a “clue” in spotting when volatility might start to spike.
Moreover, subscribers are provided with the Elliott wave labeling of the DJIA, which provides even more precision in ascertaining when to expect a change of character in the market.
The Wall Street classic book, Elliott Wave Principle: Key to Market Behavior, offers more insight into the utility of the Elliott wave model for forecasting financial markets:
Although it is the best forecasting tool in existence, the Wave Principle is not primarily a forecasting tool; it is a detailed description of how markets behave. Nevertheless, that description does impart an immense amount of knowledge about the market’s position within the behavioral continuum and therefore about its probable ensuing path.
Would you like to learn more about the Wave Principle?
If your answer is “yes,” then here’s some good news: Elliott Wave International has made the online version of Elliott Wave Principle: Key to Market Behavior available for free to Club EWI members.
Club EWI is the world’s largest Elliott wave educational community and free to join.
Follow the link and you’re on your way to having the Wall Street classic on your computer screen in moments: Elliott Wave Principle: Key to Market Behavior — free and instant access.