Fibonacci Retracement Levels
The Fibonacci sequence is named after Leonardo of Pisa, who was known as Fibonacci. Fibonacci’s 1202 book Liber Abaci introduced the sequence to Western European mathematics, although the sequence had been described earlier in Indian mathematics.
Fibonacci numbers are closely related to Lucas numbers in that they are a complementary pair of Lucas sequences. They are intimately connected with the golden ratio, for example the closest rational approximations to the ratio are 2/1, 3/2, 5/3, 8/5, … . Applications include computer algorithms such as the Fibonacci search technique and the Fibonacci heap data structure, and graphs called Fibonacci cubes used for interconnecting parallel and distributed systems. They also appear in biological settings, such as branching in trees, arrangement of leaves on a stem, the fruit spouts of a pineapple, the flowering of artichoke, an uncurling fern and the arrangement of a pine cone. Being stock traders we observe and use fibonacci numbers in our technical analysis while trading stocks.
People ask: Why do these fibonacci ratios occur in the stock market? One explanation is that the crowd that is trading the stocks is part of the nature and it’s actions result in natural behavior bound by the laws of nature, thus the prices often revolve around fibonacci levels. Another explanation is that a great number of traders and nowadays computers, watch these fibonacci levels and they act on them making it a self fulfilling prophecy providing support or resistence for prices.
Learn to apply Fibonacci ratios to calculate price targets in stocks
The Fibonacci ratio can be an invaluable tool for calculating price retracements and projections in your analysis and trading. This excerpt from The Best Technical Indicators for Successful Trading explains the origins of the Fibonacci sequence and how you can apply it to the markets.
You can read the entire Fibonacci section, plus 7 more lessons on how to use technical indicators to improve your trading for FREE, see below.
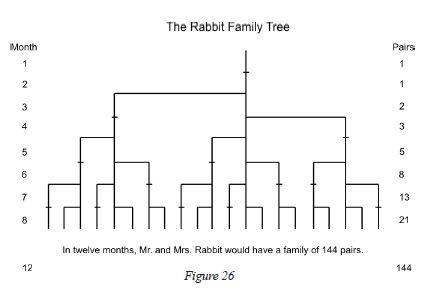
Leonardo Fibonacci da Pisa was a thirteenth-century mathematician who posed a question: How many pairs of rabbits placed in an enclosed area can be produced in a single year from one pair of rabbits, if each gives birth to a new pair each month starting with the second month? The answer: 144.
The genius of this simple little question is not found in the answer, but in the pattern of numbers that leads to the answer: 1, 1, 2, 3, 5, 8, 13, 21, 34, 55, 89, and 144. This sequence of numbers represents the propagation of rabbits during the 12-month period and is referred to as the Fibonacci sequence.
 |
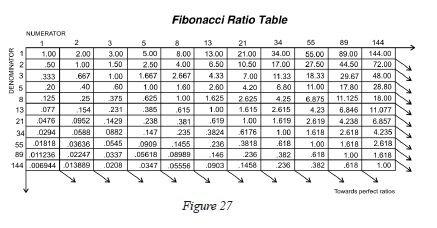
The ratio between consecutive numbers in this set approaches the popular .618 and 1.618, the Fibonacci ratio and its inverse. (Relating non-consecutive numbers in the set yields other popular ratios – .146, .236, .382, .618, 1.000, 1.618, 2.618, 4.236, 6.854….)
 |
In addition to recognizing that the stock market undulates in repetitive patterns, R. N. Elliott also realized the importance of the Fibonacci ratio. In Elliott’s final book, Nature’s Law, he specifically referred to the Fibonacci sequence as the mathematical basis for the Wave Principle. Thanks to his discoveries, we use the Fibonacci ratio in calculating wave retracements and projections today.
How to Identify Fibonacci Retracements
The primary Fibonacci ratios that I use in identifying wave retracements are .236, .382, .500, .618 and .786. Some of you might say that .500 and .786 are not Fibonacci ratios; well, it’s all in the math. If you divide the second month of Leonardo’s rabbit example by the third month, the answer is .500, 1 divided by 2; .786 is simply the square root of .618.
There are many different Fibonacci ratios used to determine retracement levels. The most common are .382 and .618. However, .472, .764 and .707 are also popular choices. The decision to use a certain level is a personal choice. What you continue to use will be determined by the markets.
It’s worth noting that Fibonacci retracements can be used on any time frame to identify potential reversal points. An important aspect to remember is that a Fibonacci retracement of a previous wave on a weekly chart is more significant than what you would find on a 60-minute chart.
See charts that show the application of Fibonacci ratios, plus 7 other lessons on technical indicators, by accessing your free report now.
Learn the Best Technical Indicators for Successful Trading
 In this free report, you will learn the tools of the trade directly from the analysts at Elliott Wave International. Using both video lessons and reports, they teach you how to incorporate technical indicators into your analysis to improve your trading decisions.
You will learn:
- How to employ Fibonacci ratios to calculate possible turning points.
- How to interpret technical indicators such as Moving Average Convergence/Divergence — MACD.
- How to exploit trendlines to uncover trading opportunities when stock charting.
- Technical patterns that can alert you to major moves, and how to know if it’s a legitimate pattern.
- And more — 8 lessons in all!
Get your Technical Indicators report now.
Elliott waves often correct in terms of Fibonacci ratios. The following article, adapted from the eBook How You Can Use Fibonacci to Improve Your Trading, explains what you can expect when a market begins a corrective phase. Learn how you can read the entire 14-page eBook below.
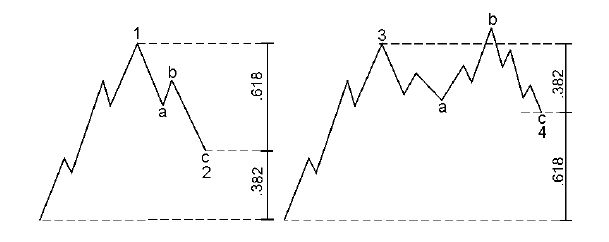 |
Retracements — Corrective Waves
If we look on the left side of this chart, we see a diagram of wave 1 followed by wave 2. It is common for second waves to retrace .618 of wave 1 — thereby making a deep retracement. We will also be looking for .786. We might often see .5, 50%, but .618 is common. On the right side, fourth waves will commonly retrace a smaller percentage or .382 of wave 3. We might also see something like .236.
Examples
I have put the wave count on this chart of the S&P 500. We have waves 1, 2, 3, 4 and 5. Wave 2 is an expanded flat. Wave 4 is a zigzag. Let’s look at the retracements that waves 2 and 4 make.
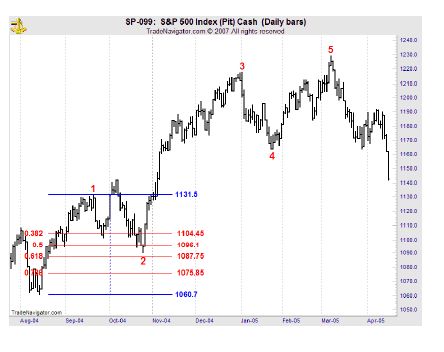 |
We see that wave 2 makes a deep retracement. It comes close to .618. Look at this Fibonacci table that I put up; notice that I put .382, .5, .618, and .786. .618 is 1087.75, and the S&P low is 1090.19.
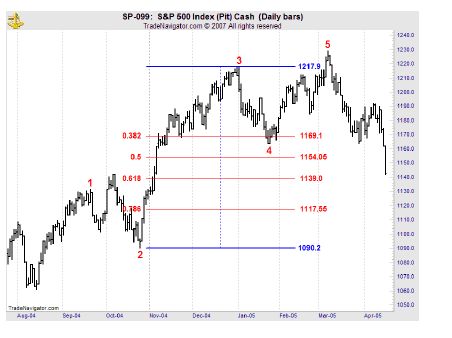 |
We see that wave 4 makes a shallow retracement of wave 3. It goes just beyond the .382 retracement. .382 is 1169.1, and wave 4 actually bottoms at 1163.75.
In a nutshell, this is what we mean when we say that Elliott waves often correct in terms of Fibonacci ratios.
 |
Learn How You Can Use Fibonacci to Improve Your TradingIf you’d like to learn more about Fibonacci and how to apply it to your trading strategy, download the entire 14-page free eBook, How You Can Use Fibonacci to Improve Your Trading.
EWI Senior Tutorial Instructor Wayne Gorman explains:
|
Applying Fibonacci to the Stock Market Patterns
Patterns are everywhere. We see them in the ebb and flow of the tide, the petals of a flower, or the shape of a seashell. If we look closely, we can see patterns in almost everything around us. The price movements of financial markets are also patterned, and Elliott wave analysis gives you the tools to interpret those patterns.
The Fibonacci sequence is vital to Elliott wave analysis — as a matter of fact, R.N. Elliott wrote that the Fibonacci sequence provides the mathematical basis of the Wave Principle. Once you understand the Fibonacci sequence, it’s easy to apply it to the markets you trade.
The following excerpt is from a new eBook from Elliott Wave International Senior Tutorial Instructor Wayne Gorman: How You Can Use Fibonacci to Improve Your Trading. Wayne explains how the Fibonacci sequence is derived and how it can be used to understand market behavior.
Learn how you can download the entire 14-page eBook below.
The Golden Ratio and the Golden Spiral
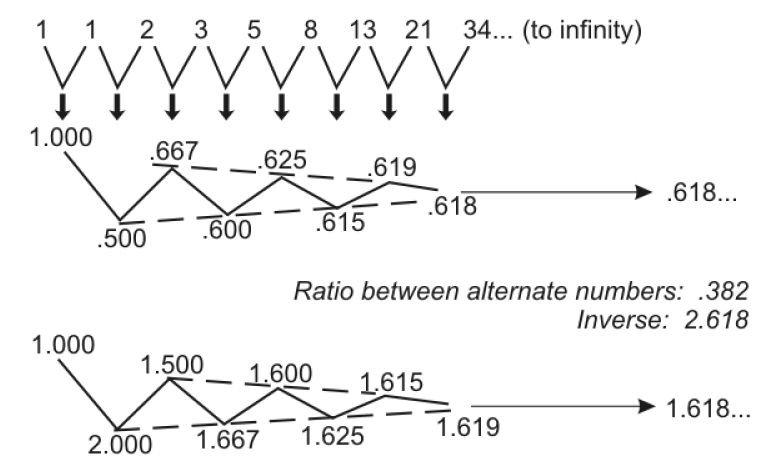 |
Let’s start with a refresher on Fibonacci numbers. If we start at 0 and then go to the next whole integer number, which is 1, and add 0 to 1, that gives us the second 1. If we then take that number 1 and add it again to the previous number, which is of course 1, we have 1 plus 1 equals 2. If we add 2 to its previous number of 1, then 1 plus 2 gives us 3, and so on. 2 plus 3 gives us 5, and we can do this all the way to infinity. This series of numbers, and the way we arrive at these numbers, is called the Fibonacci sequence. We refer to a series of numbers derived this way as Fibonacci numbers.
We can go back to the beginning and divide one number by its adjacent number — so 1÷1 is 1.0, 1÷2 is .5, 2÷3 is .667, and so on. If we keep doing that all the way to infinity, that ratio approaches the number .618. This is called the Golden Ratio, represented by the Greek letter phi (pronounced “fie”). It is an irrational number, which means that it cannot be represented by a fraction of whole integers. The inverse of .618 is 1.618. So, in other words, if we carry the series forward and take the inverse of each of these numbers, that ratio also approaches 1.618. The Golden Ratio, .618, is the only number that will also be equal to its inverse when added to 1. So, in other words, 1 plus .618 is 1.618, and the inverse of .618 is also 1.618.
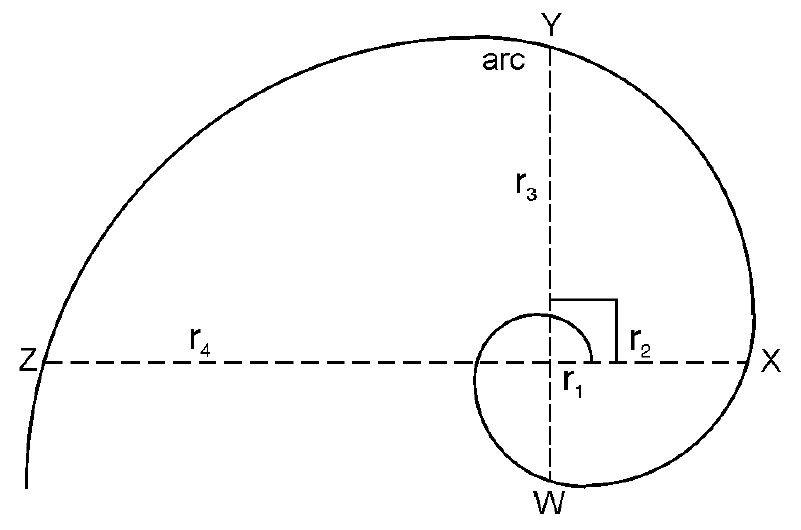 |
This is a diagram of the Golden Spiral. The Golden Spiral is a type of logarithmic spiral that is made up of a number of Fibonacci relationships, or more specifically, a number of Golden Ratios. For example, if we take a specific arc and divide it by its diameter, that will also give us the Golden Ratio 1.618. We can take, for example, arc WY and divide it by its diameter of WY. That produces the multiple 1.618. Certain arcs are also related by the ratio of 1.618. If we take the arc XY and divide that by arc WX, we get 1.618. If we take radius 1 (r1), compare it with the next radius of an arc that’s at a 90° angle with r1, which is r2, and divide r2 by r1, we also get 1.618.
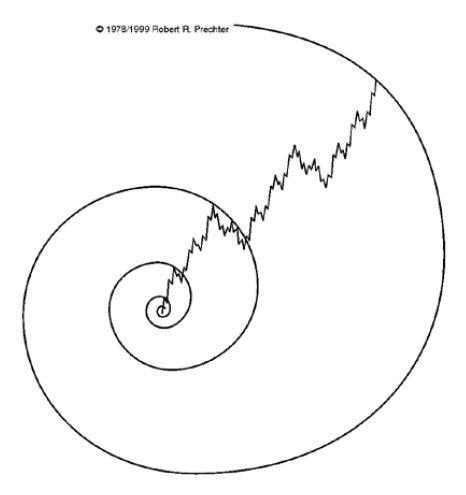
Fibonacci-Based Behavior in Financial Markets
We can visualize that the stock market or financial markets are actually spiraling outward in a sense. This is a diagram of the stock market whereby the top of each successive wave of higher degree (in terms of the Wave Principle) becomes the touch point of an exponential expansion or logarithmic spiral. We can actually visualize the market in this sense, and we will see later on, in terms of Fibonacci ratios and multiples, how this unfolds.
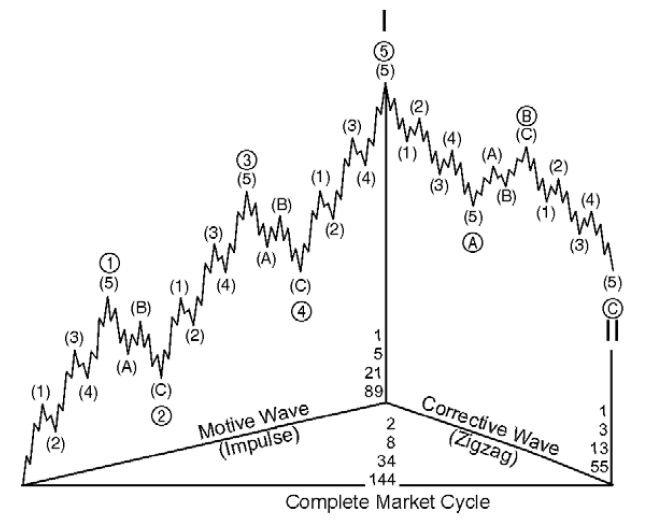
 |
This is a diagram of the Elliott wave pattern. It is a typical diagram showing us the higher degree in Roman numerals with wave I up (motive) and wave II down (corrective). One of the connections to Fibonacci ratios and numbers is that with Elliott wave, if we look at how many waves there are within each wave, we end up with Fibonacci numbers.
 |
|
Learn How You Can Use Fibonacci to Improve Your TradingIf you’d like to learn more about Fibonacci and how to apply it to your trading strategy, download the entire 14-page free eBook, How You Can Use Fibonacci to Improve Your Trading.
EWI Senior Tutorial Instructor Wayne Gorman explains:
|
How to Find Trading Opportunities in ANY Market: Fibonacci Analysis
Elliott Wave International’s Senior Analyst Jeffrey Kennedy is the editor of our Elliott Wave Trader’s Classroom and one of our most popular instructors. Jeffrey’s primary analytical method is the Elliott Wave Principle, but he also uses several other technical tools to supplement his analysis.
You can apply these methods across any market and any time frame.
Learn how you can get a free 14-page Fibonacci eBook at the end of this lesson.
The primary Fibonacci ratios that I use in identifying wave retracements are .236, .382, .500, .618 and .786. Some of you might say that .500 and .786 are not Fibonacci ratios; well, it’s all in the math. If you divide the second month of Leonardo’s rabbit example by the third month, the answer is .500, 1 divided by 2; .786 is simply the square root of .618.
There are many different Fibonacci ratios used to determine retracement levels. The most common are .382 and .618.
The accompanying charts also demonstrate the relevance of .236, .382, .500 .618 and .786. It’s worth noting that Fibonacci retracements can be used on any time frame to identify potential reversal points. An important aspect to remember is that a Fibonacci retracement of a previous wave on a weekly chart is more significant than what you would find on a 60-minute chart.
With five chances, there are not many things I couldn’t accomplish. Likewise, with five retracement levels, there won’t be many pullbacks that I’ll miss. So how do you use Fibonacci retracements in the real world, when you’re trading? Do you buy or sell a .382 retracement or wait for a test of the .618 level, only to realize that prices reversed at the .500 level?

The Elliott Wave Principle provides us with a framework that allows us to focus on certain levels at certain times. For example, the most common retracements for waves two, B and X are .500 or .618 of the previous wave. Wave four typically ends at or near a .382 retracement of the prior third wave that it is correcting.

In addition to the above guidelines, I have come up with a few of my own over the past 10 years.
The first is that the best third waves originate from deep second waves. In the wave two position, I like to see a test of the .618 retracement of wave one or even .786. Chances are that a shallower wave two is actually a B or an X wave. In the fourth-wave position, I find the most common Fibonacci retracements to be .382 or .500. On occasion, you will see wave four retrace .618 of wave three. However, when this occurs, it is often sharp and quickly reversed.
My rule of thumb for fourth waves is that whatever is done in price, won’t be done in time. What I mean by this is that if wave four is time-consuming, the relevant Fibonacci retracement is usually shallow, .236 or .382. For example, in a contracting triangle where prices seem to chop around forever, wave e of the pattern will end at or near a .236 or .382 retracement of wave three. When wave four is proportional in time to the first three waves, I find the .500 retracement significant. A fourth wave that consumes less time than wave two will often test the .618 retracement of wave three and suggests that more players are entering the market, as evidenced by the price volatility. And finally, in a fast market, like a “third of a third wave,” you’ll find that retracements are shallow, .236 or .382.
In closing, there are two things I would like to mention. First, in each of the accompanying examples, you’ll notice that retracement levels repeat. Within the decline from the high in July Sugar (first chart), each countertrend move was a .618 retracement of the previous wave. The second chart demonstrates the same tendency with the .786 retracement. This event is common and is caused by the fractal nature of the markets.
Second, Fibonacci retracements identify high probability targets for the termination of a wave; they do not represent an absolute must-hold level. So when using Fibonacci retracements, don’t be surprised to see prices reverse a few ticks above or below a Fibonacci target. This occurs because other traders are viewing the same levels and trade accordingly. Fibonacci retracements help to focus your attention on a specific price level at a specific time; how prices react at that point determines the significance of the level.
 |
Learn How You Can Use Fibonacci to Improve Your TradingIf you’d like to learn more about Fibonacci and how to apply it to your trading strategy, download the free 14-page eBook, How You Can Use Fibonacci to Improve Your Trading. EWI Senior Tutorial Instructor Wayne Gorman explains:
See how easy it is to use Fibonacci in your trading. Download your free eBook today |