Where is the gold price heading? Will gold keep crashing? Since hitting a record high of $1921.50 per ounce in September 2011, gold prices have erased 30% in value. By the end of day on October 3, 2014, gold prices were circling the drain of a 15-month low.
After such devastation, the global community of gold analysts, advisors and investors finds itself scattered as an anthill colony after being stepped on by a giant bear paw. This recent Forbes article captures the divisiveness among gold watchers:
“‘Survey Participants Split Over Gold Price Direction‘ as a potential decline in the U.S. dollar competes against ‘geopolitical reasons’ for prices to bounce.”
This magnifies an important point, namely:
Mainstream financial analysis uses news events to gauge where prices may be headed. The problem with this strategy is that it does not anticipate trend changes — it only reacts to the changes that have already happened, almost always leaving you one step behind.
Naturally, this reliable unreliability leads to uncertainty among those invested in the market’s trend.
Elliott wave analysis takes a radically different approach. Rather than looking outside the market for clues into future price action, Elliotticians look to the price charts themselves. There, they identify fixed and finite patterns which shape the market’s near- and long-term character.
You can use gold’s 3-year-long sell-off as a prime example. Back in 2010-2011, gold’s bullish “fundamental” picture was allegedly in the bag. The U.S. Federal Reserve just launched its $1-trillion-a-year quantitative easing program, which was widely expected to fuel gold’s inflationary fire. An August 25, 2011 Gallup Poll confirmed:
“Americans Choose Gold as the Best Long-Term Investment.”
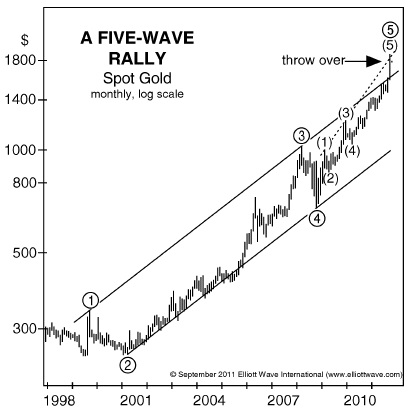
Elliott Wave International, however, saw a different outcome for gold on the metal’s price chart: an impending decline. In theSeptember 2011 Elliott Wave Financial Forecast, our analysis included the following chart, which showed gold prices at or near the end of a decade-long, 5-wave advance.
“Gold’s wave structure is consistent with a terminating rise. [Elliott waves progress and therefore top out in 5 waves]. As this monthly chart shows, prices exceeded the upper line of the channel formed by the rally from the 1999 low in what Elliott terms a throw-over. A throw-over occurs at the end of a fifth wave, and represents a final burst of buying. The pattern is confirmed as complete once prices close back under the upper line, which currently crosses $1650.”
So, that was then. What about now?
Today, the mainstream is divided between opposing fundamental forces. But at the San Francisco Money Show in August 2014, Elliott Wave International’s chief market analyst Steve Hochberg identified a very compelling reason to form a united front in gold’s future — an Elliott wave triangle pattern.
You can hear the exact point when Steve shared this exciting development to his audience via this clip from his Money Show presentation:
Steve goes on to explain how pinpointing this triangle helps him lay down a forecast for “what gold is going to do from here on out.”
Would you believe that gold prices should “rally” for a year, maybe even two??
Would you also believe you can watch Steve’s entire Money Show presentation on gold (not just the 30-second preview featured here!), FREE?
Well, you absolutely can. For a limited time only, Elliott Wave International is releasing Steve’s Money Show presentation on gold — in two 5-minute long videos.
This very special offer is FREE to all Club EWI members. Simply complete your free Club EWI profile and get instant access to Steve’s presentation >>