Let’s start by establishing that the stock market is not driven by the news. Aggregate stock prices are driven by waves of optimism and pessimism — which go from one extreme to another — as reflected by the Elliott wave model. That’s what makes the stock market predictable.
Hence, Elliott wave analysis is at the core of EWI’s stock market forecasts.
Having said that, sentiment indicators are also valuable in providing clues about “what’s next.”
For example, Robert Prechter’s book, Prechter’s Perspective, made this observation:
No crowd buys stocks of other countries intelligently. For decades, heavy foreign buying in the U.S. stock market has served as an excellent indicator of major tops.
Well, in the year 2000, that’s exactly what happened. Foreign purchases of U.S. shares spiked to a then record $402 billion in March 2000. The spike in foreign buying coincided precisely with a price peak in the S&P 500. From the month of the high in March 2000 through October 2002, the S&P declined 51%.
Fast forward to December 2019, when our Elliott Wave Financial Forecast showed two charts related to overseas buying of U.S. shares. Here’s the first one:
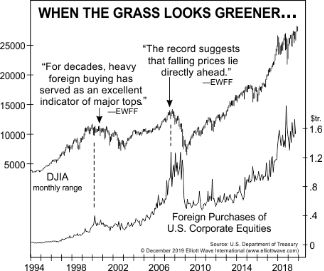
This chart notes our discussion about foreign buying in the year 2000 and also in August 2007: “The first five months of [2007] produced what was easily the biggest gusher of net foreign buying in history. The record suggests that falling prices lie directly ahead for the U.S. market.”
The historic stock market top of 2007 occurred just two months later.
Here’s the second chart from the December 2019 Elliott Wave Financial Forecast, along with the commentary:
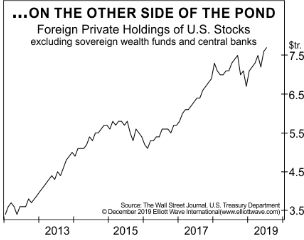
The chart of foreign holdings of U.S. stocks shows a new record of $7.7 trillion in total stock holdings as of July [2019]. On November 7, The Wall Street Journal reported that the “appetite for U.S. shares among international clients has shown few signs of abating.” Foreigners are all in on the U.S. stock market rally. Our bet is that it will end in a major top just as it did in 2000 and 2007.
Plus, the Elliott wave model was also indicating that the stock market top was approaching. The Jan. 2020 Elliott Wave Financial Forecast noted:
The rally is the final [wave] of the bull market.
The February 2020 stock market top occurred just a month later.
As you know, historic stock market volatility has unfolded since then. Interestingly, during highly emotional markets — such as what investors face now — Elliott waves tend to be clear.
So, now is the ideal time to learn all you can about the Elliott wave method of analyzing and forecasting financial markets.
You can do so free!
You see, when you signup for a free Club EWI membership, you get instant, free access to the online version of the book, Elliott Wave Principle: Key to Market Behavior, by Frost & Prechter. You can have this Wall Street classic on your computer screen in just moments!