This Will Signal the Bear Market’s Halfway Point
On March 12, the date the DJIA closed lower more than 2350 points, the U.S. chief equity strategist for a major financial firm appeared on Bloomberg after the market close and opined that “90% of the damage has been done.”
He went on to affirm that if an investor’s time horizon is longer than two weeks, then yes, the stock market plunge represents a good buying opportunity.
Well, if that’s the sentiment after the DJIA had shed more than 28% (through March 12), then the downturn may have ways more to go than just another 10%. In other words, such financial confidence is usually not the prevailing sentiment near the end of a bear market.
Now, granted, this was just one opinion… except, it isn’t. The chief equity strategist’s sentiment is just one example of an entrenched financial optimism.
As our March 11 Elliott Wave Theorist says:
As yet, fear is nowhere near epic. … Relative to the size and breadth of the down days, TRINs have been remarkably low. All moving averages from 3 to 55 days are between 1.00 and 1.30, indicating nearly equal volume distribution in down stocks vs. up stocks. In other words, there has been no panic…
How do you know when a bear market is past its midpoint? Answer: when people stop cheering for lower prices.

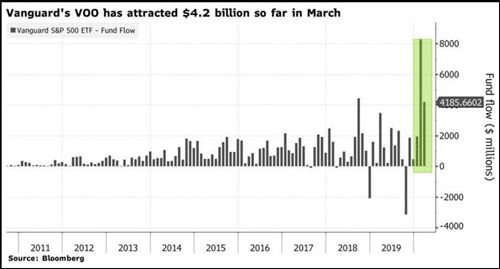
A Bloomberg article reported, “Vanguard’s VOO attracted nearly $4.2 billion so far in March.” What is the VOO, you ask? It is an exchange-traded fund representing the S&P 500 that is “commonly used by retail investors.” The phrase, “so far in March,” means just over the past 7 trading days. Inflows in the down month of February were $8.3 billion. [The graph] tells you all you need to know: Each day, people think they are buying a low. When the real low arrives, they will be selling.
The scores of technical indicators that our analysts study are revealing a lot about the potential depth of the unfolding bear market.
Of course, our primary analytical tool is the Elliott wave model.
It tells us that, even though the market’s recent dramatic behavior is rare, it is not unprecedented. Meaning, we can see one or more scenarios of how things will progress from here.
The good news is that you can access our latest Elliott wave analysis 100% free.
You see, Elliott Wave International has been guiding investors through bull and bear markets since 1979. From that long experience, EWI’s team of experienced analysts know that at certain market junctures, they can help the most by providing their latest analysis free.
Now is one of those market junctures.
Elliott Wave International has just made the entire “Stocks” section of their flagship market letter, the monthly Elliott Wave Financial Forecast, available to all its free Club EWI members. It’s a rare opportunity to see what EWI’s subscribers are reading.
Read the Financial Forecast excerpt now, free
This will help you understand how the markets got to this juncture — and, more importantly what’s likely next.
Also, please feel free to share this special excerpt with friends and family.