Will the Dow Industrials hit 100,000 in the next decade?
Well, the answer posed by the question in the title is a resounding “yes!” — according to the British financial magazine, MoneyWeek.
The cover of the Dec. 4 issue of the magazine is titled “The Roaring 2020s, Prepare Your Portfolio for a Boom.” An image of Janet Yellen is front and center. Of course, she’s the former Federal Reserve chair and the reported pick for Treasury Secretary in a new administration. She’s dressed in a 1920s party outfit and looks very festive.
Yet, stock market valuations are different when you compare the start of the 1920s with the 2020s in the U.S. Here’s a quote from the December Elliott Wave Financial Forecast, a monthly publication which provides analysis of major U.S. financial markets:
As the bull market began in August 1921, the S&P 500 price-to-earnings ratio was 14. In September 1926, three years before the 1929 peak, the market’s p/e ratio was 10.72, even more subdued than in 1921. By the time that September 1929 arrived, the market’s p/e ratio had jumped to 20.17. At the February high this year, the S&P 500’s p/e ratio was 25.43. By December 1, it was an even higher 36.67. Other market valuation measures are just as extreme.
Even so, the extreme optimism conveyed on the MoneyWeek cover is also reflected in a recent survey of market strategists. Here’s a quote from a Dec. 8 CNBC article:
A majority of analysts surveyed by CNBC expect [an] 8%-22% upside for the S&P 500 in 2021.
There are other signs of extreme bullish sentiment.
Here’s just one of them as we return to the December Elliott Wave Financial Forecast with this chart and commentary:
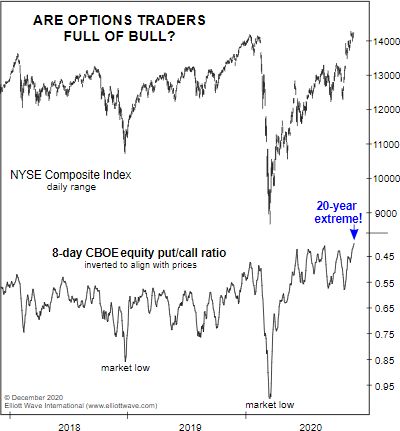
The option markets offer further evidence of intense speculation. The 8-day CBOE equity put/call ratio declined to .40 on Wednesday, the most extreme level of call buying to put buying in over 20 years. The last time the 8-day p/c ratio was lower was July 18, 2000, at the top of the initial rebound in the NASDAQ’s bear market from March 2000 to October 2002.
The December Elliott Wave Financial Forecast also provides Elliott wave analysis of the U.S. stock market.
Elliott wave analysis will help you to stay ahead of the market’s next big turn.
As the Wall Street classic book, Elliott Wave Principle: Key to Market Behavior, by Frost & Prechter, says:
Learn about the rules and guidelines of the Elliott wave method for analyzing and forecast financial markets by reading entirety of the online version of Elliott Wave Principle: Key to Market for free.
Free access to the book is granted upon joining Club EWI, the world’s largest Elliott Wave educational community. Club EWI membership is free and allows you to tap into valuable trading and investing insights from an Elliott wave perspective.
It is a thrilling experience to pinpoint a turn, and the Wave Principle is the only approach that can occasionally provide the opportunity to do so.
Get started by following this link now: Elliott Wave Principle: Key to Market Behavior– free and unlimited access.