Relative strength index
The Relative Strength Index (RSI) is a technical analysis oscillator showing price strength by comparing upward and downward close-to-close movements.
The RSI is popular because it is relatively easy to interpret. It was developed by J. Welles Wilder and published in Commodities magazine (now called Futures magazine) in June 1978, and in his New Concepts in Technical Trading Systems the same year.
Note that the term relative strength also refers to the strength of a security in relation to the overall market or to its sector. For instance XYZ might rise 2% when the rest of the market rises 1%. This is sometimes called relative strength comparative to avoid confusion. It’s unrelated to the Relative Strength Index described here.
Calculation
For each day an upward change U or downward change D amount is calculated. On an up day, ie. today’s close higher than yesterday’s,
- U = closetoday −- closeyesterday
- D = 0
Or conversely on a down day (notice D is a positive number),
- U = 0
- D = closeyesterday −- closetoday
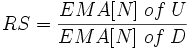
If today’s close is the same as yesterday’s, both U and D are zero. An average U is calculated with an exponential moving average using a given N-days smoothing factor, and likewise for D. The ratio of those averages is the Relative Strength,
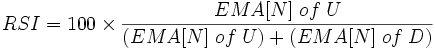
This is converted to a Relative Strength Index between 0 and 100,
This can be rewritten as follows to emphasise the way RSI expresses the up as a proportion of the total up and down (averages in each case),
The EMA in theory uses an infinite amount of past data (as discussed in the EMA article). It’s necessary either to go back far enough, or alternately at the start of data begin with a simple average of N days instead,
and then continue from there with the usual EMA formula,
(Similarly with D.)
Interpretation
Wilder recommended a smoothing period of N=14. This is by his reckoning of EMA smoothing (see the EMA article on that), ie. α=1/14.
Wilder considered a security overbought if it reached the 70 level, meaning that the speculator should consider selling. Or conversely oversold at the 30 level. The principle is that when there’s a high proportion of daily movement in one direction it suggests an extreme, and prices are likely to reverse. Levels 80 and 20 are also used, or may be varied according to market conditions (eg. a bull market may have an upward bias).
Large surges and drops in securities will affect RSI, but it could just be a false buy or sell. The RSI is best used as a complement with other technical analysis indicators.
Cutler’s RSI
A variation called Cutler’s RSI is based on a simple moving average of U and D, instead of the exponential average above.
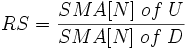
This is like the initial data point calculation shown above, but used on every day, not just the first. The divisor N in the SMAs in the numerator and denominator cancel out, so one needn’t do those divisions, instead just a sum of U and a sum of D over the past N days can be made.
Cutler’s RSI generally comes out slightly different from the normal Wilder RSI, but the two are similar, since an SMA and EMA are of course quite similar.
Copyright (c) 2006 TradingStocks.NET Permission is granted to copy, distribute and/or modify this document under the terms of the GNU Free Documentation License, Version 1.2 or any later version published by the Free Software Foundation; with no Invariant Sections, no Front-Cover Texts, and no Back-Cover Texts. A copy of the license is included in the section entitled “GNU Free Documentation License”.