The Final Act BEFORE a Housing Bubble Bursts
Here’s a time-tested indicator of trend turns in financial markets
Financial history shows that feverish foreign buying of a financial asset usually marks the end of that asset’s upward trend.
The reason why is that foreign buyers tend to enthusiastically jump on a trend after it’s already run its course — or nearly so.
You can find an example of this going as far back as Tulip Mania in Holland in the 1600s. But let’s stick with history which goes back just a generation or so, namely, the commercial real estate boom of the late 1980s.
Japan’s stock market had been racing higher and Japanese investors were pouring money into U.S. real estate. One of their prize purchases was Rockefeller Center in 1989. Mitsubishi paid $2 billion for this “Hope Diamond of world real estate.” By 1995, Rockefeller Center went bankrupt and Mitsubishi lost its entire investment.
Another case in point is the U.S. stock market in 2007.
The August 2007 Global Market Perspective, a monthly Elliott Wave International publication which covers 50-plus worldwide financial markets, showed this chart and said:
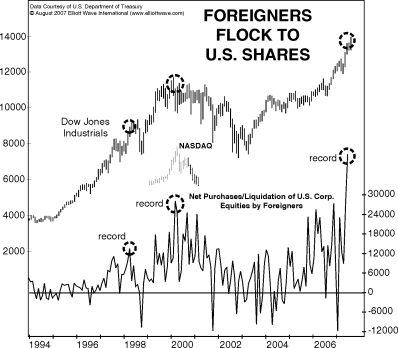
Foreigners jumped into the U.S. market like never before in May [2007]. The new record was a full third higher than the old one, which was set in February 2000, one month after the Dow Industrials’ 2000 peak. … The first five months of [2007] produced what was easily the biggest gusher of net foreign buying in history. The record suggests that falling prices lie directly ahead for the U.S. market.
Two months after that analysis was provided, the Dow Industrials topped, and then entered a bear market which lasted nearly a year and a half.
What does all of this have to do with today?
Get this: Chinese investors spent a record $6.1 billion on U.S. homes from April 2021 through March 2022, according to the National Association of Realtors.
Canada was second on the list — buyers there spent $5.5 billion on U.S. residential real estate. Buyers from India ranked third at $3.6 billion.
So this July Washington Post headline is not surprising:
The housing market, at last, appears to be cooling off
Here’s a quote from the Elliott Wave Theorist, a monthly publication which has provided analysis of financial markets and major cultural trends since 1979:
A burst in the U.S. housing bubble could have enormous repercussions in the world economy. The aggregate value of housing is far greater than that of the stock market, so fluctuations in house prices may have a much greater effect on consumer spending.
This was written in January 2006 — about six months before the peak in the prior housing bubble, which helped to usher in the Great Recession.
Another housing market indicator is none other than the stock market. In other words, the housing market tends to be correlated with the trend of the stock market.
Elliott wave analysis can help you anticipate what’s next for the stock market. If you need a refresher on the Elliott wave model, you are encouraged to read Frost & Prechter’s book, Elliott Wave Principle: Key to Market Behavior. Here’s a quote from this Wall Street classic:
In markets, progress ultimately takes the form of five waves of a specific structure. Three of these waves, which are labeled 1, 3 and 5, actually effect the directional movement. They are separated by two countertrend interruptions, which are labeled 2 and 4. The two interruptions are apparently a requisite for overall directional movement to occur.
You can delve deeper into the Wave Principle by reading the entire online version of the book for free!
The only requirement for free and unlimited access is a Club EWI membership, which is also free.
Club EWI is the world’s largest Elliott wave educational community and members enjoy complimentary access to a wealth of Elliott wave resources on financial markets, investing and trading without any obligations.
Simply follow the link to get started right away: Elliott Wave Principle: Key to Market Behavior — get instant access — free.