Contrarian Trading Strategies
Sentiment Measure Shows No Fear of Major U.S. Stock Decline – If investors are climbing a “wall of worry,” where’s the evidence?
August 17, 2012
“Successful market timing depends upon learning the patterns of crowd behavior. By anticipating the crowd, you can avoid becoming a part of it.”
I pulled this quote directly from the opening paragraphs of the free Online Elliott Wave Tutorial. It’s critical to your understanding of how markets really work.
The stock market’s recent rally has seemed to ignore Europe’s debt crisis and the weak U.S. economy, and in turn commentators have dusted off an old Wall Street phrase: wall of worry.
- Why Stocks are Climbing the Wall of Worry — Equities.com, Aug. 10
- Global stocks have been rallying in recent weeks, climbing a “wall of worry” — CNBC, Aug. 8
- We do this thing on Wall Street called climbing the wall of worry. — ABC News, Aug. 7
- Stocks scale wall of worry — Marketwatch, July 19
That’s just a small sample of recent “wall of worry” quotes.
However, one reliable indicator of trader sentiment tells a different story: that traders have few if any worries about a big market plunge.
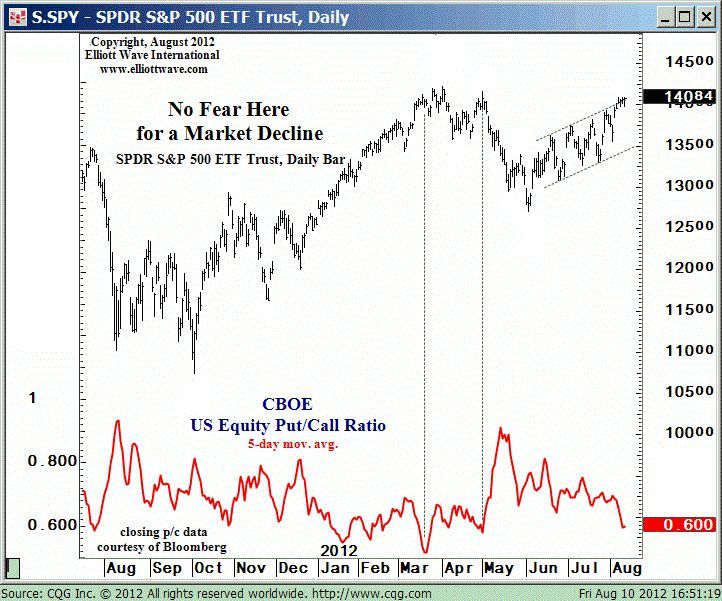
In fact, the sentiment among traders has been bullish, as noted by the Aug. 10 Financial Forecast Short Term Update [wave labels removed from the chart].
[The chart below] plots the 5-day closing CBOE Equity put/call ratio, which declined to .60 at yesterday’s [Aug. 9] close. That was the lowest close since May 1 (.58)…This measure shows a greatly diminished amount of put volume relative to call volume, indicating that traders feel complacent toward the need to hedge against a major decline in stocks.
 |
Trader sentiment is one of the pillars of market analysis and forecasting — two other such pillars are wave structure and momentum.
All three pillars now send the same market message.
Do not expect commentators to discuss these pillars. The crowd is almost always on the wrong side of the market. Start looking at investment opportunities independently and learn to use wave analysis.
Start learning to count waves for yourself – for FREE
 |
Learn the Why, What and How of Elliott Wave Analysis
The Elliott Wave Crash Course is a series of three FREE videos that demolishes the widely held notion that news drives the markets. Each video will provide a basis for using Elliott wave analysis in your own trading and investing decisions. |
By Definition, Only the Few Can Sell At The Top
Otherwise, top would not have been a top. Thus, the crowd is correct during the trend, but it is wrong during turning points. You need to recognize these turning points before it is too late to be able to make meaningful profits in any market you invest or trade.
Stock market is a zero sum game. In the absence of meaningful dividends, stock market is almost like a casino. A game of musical chairs. Some money comes in, it gets redistributed between participants, few get rich at others expense, and most loose money. You must strive to be among the winners.
Now some might say, “What’s wrong with following the crowd? I’m just following the easy money, right?” The problem with this logic is that most investors follow the crowd (or herd) all the way up the mountain … then right off the cliff.
Look at today’s situation: How many people you know got out of the stock market before the October 2007 top? Heck, how many you know cut losses and cashed out even six months after the top?
If you’re like most people, your answer ranges from “zero” to “very few.”
Being a successful investor over the long term means you must always strive to be part of that “very few.”
Famed market analyst Robert Prechter, the leading practitioner of the Elliott wave method of market analysis, once said, “Missing a market move may be a shame, but getting caught on the wrong side of one means you lose money. People who have gone through the experience know there’s a big difference.”
To be a successful individual investor, you must understand what it means to take risks when the probabilities are behind you and shun risk when they’re not.
Robert Prechter’s method of analysis, the Elliott Wave Principle, is designed to help him and his subscribers do just that. In fact, just this week, a MarketWatch.com columnist wrote this about Prechter’s performance:
- “Over the past 12 months the Elliott Wave Financial Forecaster is up 22.8% by Hulbert Financial Digest count, vs. negative 43.32% for the dividend-reinvested Dow Jones Wilshire 5000.
- “And so terrible has the damage to the stock market been that the HFD now shows EWFF ahead over the past 10 years, with a annualized gain of 1.7% vs. negative 2.55% annualized for the total return DJ-W.”
Buy and hold is dead. Trading isn’t any easier. Having a big-picture outlook doesn’t mean you must “set it and forget it,” as the late-night infomercial guy says. And it certainly doesn’t mean you must be in and out of the markets every day. It simply means you can see the forest for the trees.
You can go long when the markets are behind you, short if you have the guts, and stay out completely when the risk is too high. Simply put, adopting an independent, unbiased method is the very best way to ensure you don’t get caught up in the investment herd.
Elliott wave analysis is not for everyone. It’s highly technical. And it presents probabilities, not certainties (there’s no such thing as a black box trading system). The most successful investors and analysts – the guys who are still around after 30 years like Prechter – are able to assign probabilities and assess risk; and they act only when probabilities are high and risk is not.
I encourage you to learn more about the method that has kept Robert Prechter out of the herd and in the game for more than three decades. His company, Elliott Wave International, has an extremely useful Elliott Wave Tutorial for free online. It’s broken up into 10 lessons across 50 pages, so it’s easy to read and review at your leisure.
Check it out at the link below, give yourself some time to digest it, and decide for yourself if Elliott is a method you should add to your investment arsenal.
Separate your investments from the herd; download the free Elliott Wave Tutorial today
At turnings points, the crowd tends to be over confident. Close to a market top, a high percentage of bulls tend to et on the upside. Similarly, at a market bottom, a high percentage of traders tend to bet on the downside. Back in March 2009, a record 98% of traders were betting that stocks would fall further. That means we already ran out of sellers. 98% of traders were candidates to convert to the bullish cause. Similarly, at a market top, as we run out of buyers the rally looses steam. In April 2010, 90% plus of traders were bullish. Everybody bought stocks and started to wait for prices to go ever higher so that they could sell to the greater fool.
April 8, 2010: Prechter on Fast Money Show: Bulls don’t let Prechter speak! And that’s a sell signal!