Did you know that most traders loose money on the long run? Yes. This is because the stock market is a zero sum game. Only the few can consistently make money. It is a casino where the participants place their bets, the wheel turns and the money gets redistributed. If you want to speculate in the markets, you have to arm yourself with the right tools that turn the odds in your favor. Today, we will look into one the technical analysis tools you have at your disposal: Elliott Wave Theory.
The Elliott Wave Theory
In the 1930s, Ralph Nelson Elliott, a corporate accountant by profession, studied price movements in the financial markets and observed that certain patterns repeat themselves. He offered proof of his discovery by making astonishingly accurate stock market forecasts. What appears random and unrelated, Elliott said, will actually trace out a recognizable pattern once you learn what to look for. Elliott called his discovery “The Elliott Wave Principle,” and its implications were huge. He had identified the common link that drives the trends in human affairs, from financial markets to fashion, from politics to popular culture.
Robert Prechter, Jr., president of Elliott Wave International, resurrected the Wave Principle from near obscurity in 1976 when he discovered the complete body of R.N. Elliott’s work in the New York Library. Robert Prechter, Jr. and A.J. Frost published Elliott Wave Principle in 1978. The book received enthusiastic reviews and became a Wall Street bestseller. In Elliott Wave Principle, Prechter and Frost’s forecast called for a roaring bull market in the 1980s, to be followed by a record bear market. Needless to say, knowledge of the Wave Principle among private and professional investors grew dramatically in the 1980s.
When investors and traders first discover the Elliott Wave Principle, there are several reactions:
- Disbelief – that markets are patterned and largely predictable by technical analysis alone
- Joyous “irrational exuberance” – at having found a “crystal ball” to foretell the future
- And finally the correct, and useful response – “Wow, here is a valuable new tool I should learn to use.”
 Just like any system or structure found in nature, the closer you look at wave patterns, the more structured complexity you see. It is structured, because nature’s patterns build on themselves, creating similar forms at progressively larger sizes. You can see these fractal patterns in botany, geography, physiology, and the things humans create, like roads, residential subdivisions… and – as recent discoveries have confirmed – in market prices.
Natural systems, including Elliott wave patterns in market charts, “grow” through time, and their forms are defined by interruptions to that growth.
Here’s what is meant by that. When your hands formed in the womb, they first looked like round paddles growing equally in all directions. Then, in the places between your fingers, cells ceased growing or died, and growth was directed to the five digits. This structured progress and regress is essential to all forms of growth. That this “punctuated growth” appears in market data is only natural – as Robert Prechter, Jr., the world’s foremost Elliott wave expert and president of Elliott Wave International, says, “Everything that thrives must have setbacks.”
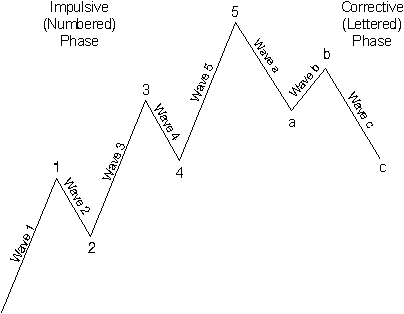
The first step in Elliott wave analysis is identifying patterns in market prices. At their core, wave patterns are simple; there are only two of them: “impulse waves,” and “corrective waves.”
Impulse waves are composed of five sub-waves and move in the same direction as the trend of the next larger size (labeled as 1, 2, 3, 4, 5). Impulse waves are called so because they powerfully impel the market.
A corrective wave follows, composed of three sub-waves, and it moves against the trend of the next larger size (labeled as a, b, c). Corrective waves accomplish only a partial retracement, or “correction,” of the progress achieved by any preceding impulse wave.
As the figure to the right shows, one complete Elliott wave consists of eight waves and two phases: five-wave impulse phase, whose sub-waves are denoted by numbers, and the three-wave corrective phase, whose sub-waves are denoted by letters.
What R.N. Elliott set out to describe using the Elliott Wave Principle was how the market actually behaves. There are a number of specific variations on the underlying theme, which Elliott meticulously described and illustrated. He also noted the important fact that each pattern has identifiable requirements as well as tendencies. From these observations, he was able to formulate numerous rules and guidelines for proper wave identification. A thorough knowledge of such details is necessary to understand what the markets can do, and at least as important, what it does not do.
Short S&P 500 at August 2007 top and cover end of February 2009?
Sounds too good to be true? Well, our friends at Elliot Wave International did it. Learn how these people read the market sentiment like a crystal ball and successfully signaled a trade that brought 900 point profit when the market crashed.
Learn from Robert Prechter, the man who predicted the 80s bull market before 80s. Prechter successfully predicted the 87 crash weeks before. He is the author of 2002 book Conquer the Crash which explained the current crash step by step including the deflation that nobody believed in.
You have only just begun to learn the power and complexity of the Elliott Wave Principle. So, don’t let your Elliott wave education end here. Join Elliott Wave International’s free Club EWI and access the Basic Tutorial: 10 lessons on The Elliott Wave Principle and learn how to use this valuable tool in your own trading and investing.
You can also watch the Elliott wave crash course video for free:
 |
What Moves the Stock Market?
Here is a socionomic view – from Robert Prechter – that explains the social mood of the population in aggregate is what moves the markets:
The Stock Market Is Patterned
You don’t have to sift through the latest economic data as if they were tea leaves.
This is an excerpt from Elliott Wave International’s free Club EWI resource, “What Can a Fractal Teach Me About the Stock Market?” by EWI’s president Robert Prechter.
In the 1930s, Ralph Nelson Elliott described the stock market as a fractal — an object that is similarly shaped at different scales. Scientists today recognize financial markets’ price records as fractals, but they presume them to be of the indefinite variety. Elliott found something different:
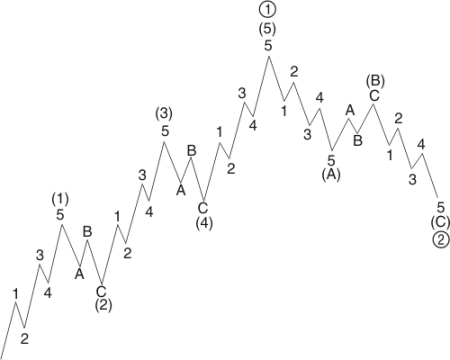 |
You see that each “wave” within the overall structure subdivides in a specific way. If the wave is heading in the same direction as the wave of one larger degree, then it subdivides into five waves. If the wave is heading in the opposite direction as the wave of one larger degree, then it subdivides into three waves (or a variation).
Understanding how the market progresses at all degrees of trend gives you an invaluable perspective. No longer do you have to sift through the latest economic data as if they were tea leaves. You gain a condensed view of the whole panorama of essential trends in human social mood and activity, as far back as the data can take you.
OK, now you try it. Figure 3-7 shows an actual price record. Does this record depict two, three, four or five completed waves? Based on your answer, what would you call for next?
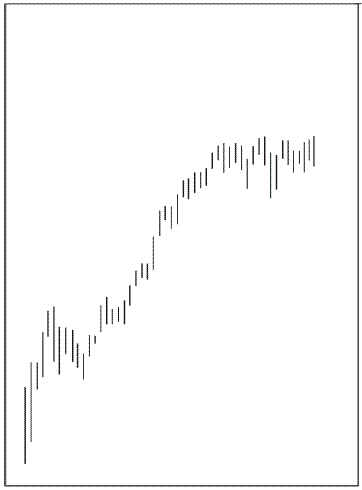 |
Let’s compare your answer with mine. From the simple idea that a bull market comprises five waves, The Elliott Wave Theorist in September 1982 called for the Dow to quintuple to nearly 4000 and on October 6 announced, “Super bull market underway!” The November 8 issue then graphed the forecast for the expected fifth wave up, as you can see in Figure 3-8.
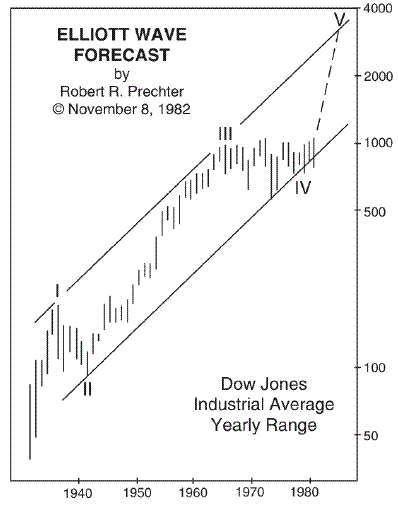 |
As you can see, Elliott waves are clear not only in retrospect. They are often — particularly at turning points — quite clear in prospect.
Read the rest of this important report now, free! All you need is to create a free Club EWI profile. Here’s what you’ll learn:
- How Is the Stock Market Patterned?
- The Necessity and Efficiency of .5-3.
- Examples of Real-World Long-Term Waves: DJIA, Gold, CRB
- The Fibonacci Sequence in the Wave Principle
- Why Is the Stock Market Patterned? Investors’ Herding Impulse
- More
Visit Elliott Wave International to learn more about the free “What Can a Fractal Teach Me About the Stock Market?” report.
Learn Elliott Wave Analysis
Millions of people have joined the ranks of online traders since the start of the pandemic, and you may be one of them. Or maybe you’ve been trading for years already…
…either way, we have something special for you.

In EWI’s Store, it sells for $99. You get it FREE, with a fast and easy Club EWI sign-up.
The course is from EWI’s chief instructor, Jeffrey Kennedy. Over 1 hour, Jeff shows you his three favorite ways to combine Elliott waves with simple technical tools to identify and act on real-market trade setups faster and more accurately.
These three setups are easier to spot on a chart once you know what to look for.
Take the course now, FREE: “My 3 Favorite Trade Setups” ($99 value) >>
Often, basics is all you need to know.
Understand the basics of the subject matter, break it down to its smallest parts — and you’ve laid a good foundation for proper application of… well, anything, really. That’s what we had in mind when we put together our free 10-lesson online Basic Elliott Wave Tutorial, based largely on Robert Prechter’s classic “Elliott Wave Principle — Key to Market Behavior.” Here’s an excerpt:
- Successful market timing depends upon learning the patterns of crowd behavior. By anticipating the crowd, you can avoid becoming a part of it. …the Wave Principle is not primarily a forecasting tool; it is a detailed description of how markets behave. In markets, progress ultimately takes the form of five waves of a specific structure.
- The personality of each wave in the Elliott sequence is an integral part of the reflection of the mass psychology it embodies. The progression of mass emotions from pessimism to optimism and back again tends to follow a similar path each time around, producing similar circumstances at corresponding points in the wave structure.
- These properties not only forewarn the analyst about what to expect in the next sequence but at times can help determine one’s present location in the progression of waves, when for other reasons the count is unclear or open to differing interpretations.
- As waves are in the process of unfolding, there are times when several different wave counts are perfectly admissible under all known Elliott rules.It is at these junctures that knowledge of wave personality can be invaluable. If the analyst recognizes the character of a single wave, he can often correctly interpret the complexities of the larger pattern.
- The following discussions relate to an underlying bull market… These observations apply in reverse when the actionary waves are downward and the reactionary waves are upward.
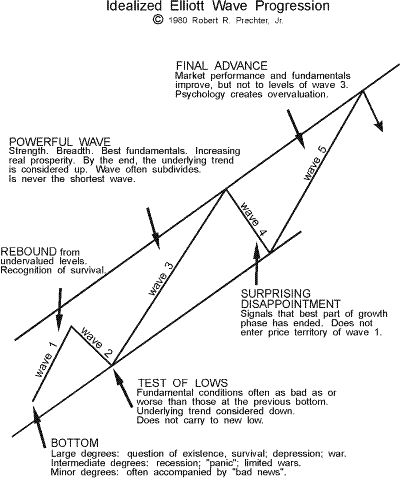
1) First waves — …about half of first waves are part of the “basing” process and thus tend to be heavily corrected by wave two. In contrast to the bear market rallies within the previous decline, however, this first wave rise is technically more constructive, often displaying a subtle increase in volume and breadth. Plenty of short selling is in evidence as the majority has finally become convinced that the overall trend is down. Investors have finally gotten “one more rally to sell on,” and they take advantage of it. The other half of first waves rise from either large bases formed by the previous correction, as in 1949, from downside failures, as in 1962, or from extreme compression, as in both 1962 and 1974. From such beginnings, first waves are dynamic and only moderately retraced. …
Read the rest of this 10-lesson Basic Elliott Wave Tutorial online now, free! Here’s what you’ll learn:
- What the basic Elliott wave progression looks like
- Difference between impulsive and corrective waves
- How to estimate the length of waves
- How Fibonacci numbers fit into wave analysis
- Practical application tips for the method
- More
Keep reading this free tutorial today.
Elliott Wave International (EWI) is the world’s largest market forecasting firm. EWI’s 20-plus analysts provide around-the-clock forecasts of every major market in the world via the internet and proprietary web systems like Reuters and Bloomberg. EWI’s educational services include conferences, workshops, webinars, video tapes, special reports, books and one of the internet’s richest free content programs, Club EWI.
Video: The Real-Time Power of Elliott Wave Analysis
Mainstream financial analysts always look for ways to explain market action through news stories and events. Conventional wisdom states that news and inter-market correlations cause market booms and busts, but such explanations rely on selective presentation of the data. In this video, Elliott Wave International’s Asian-Pacific Financial Forecast Editor Mark Galasiewski shows you how Elliott wave analysis was able to predict Hong Kong’s late ’90s mania and its aftermath in real time — without looking at the news or the market’s “fundamentals.”
Watch More about the Power of Elliott Wave Analysis in this FREE Video
Discover how Elliott wave analysis gives you a consistently logical explanation — and debunk one of the major myths of what caused the Asian Financial Crisis — in the free video, “The Real-Time Power of Elliott Wave Analysis: Debunking the Myths of the Asian Financial Crisis.” Access Your FREE Video Now.
How Elliott Wave Principle Can Improve Your Trading
The Wave Principle identifies trend, countertrend, maturity of a trend — and more.
The following article is an excerpt from Elliott Wave International’s Trader’s Classroom Collection.
Every trader, every analyst and every technician has favorite techniques to use when trading. But where traditional technical studies fall short, the Wave Principle kicks in to show high probability price targets and, just as importantly, how to distinguish high probability trade setups from the ones that traders should ignore.
Where Technical Studies Fall Short
There are three categories of technical studies: trend-following indicators, oscillators and sentiment indicators. Trend-following indicators include moving averages, Moving Average Convergence-Divergence (MACD) and Directional Movement Index (ADX). A few of the more popular oscillators many traders use today are Stochastics, Rate-of-Change and the Commodity Channel Index (CCI). Sentiment indicators include Put-Call ratios and Commitment of Traders report data.
Technical studies like these do a good job of illuminating the way for traders, yet they each fall short for one major reason: they limit the scope of a trader’s understanding of current price action and how it relates to the overall picture of a market. For example, let’s say the MACD reading in XYZ stock is positive, indicating the trend is up. That’s useful information, but wouldn’t it be more useful if it could also help to answer these questions: Is this a new trend or an old trend? If the trend is up, how far will it go? Most technical studies simply don’t reveal pertinent information such as the maturity of a trend and a definable price target — but the Wave Principle does.
How Does the Wave Principle Improve Trading?
Here are five ways the Wave Principle improves trading:
1. Identifies Trend – The Wave Principle identifies the direction of the dominant trend. A five-wave advance identifies the overall trend as up. Conversely, a five-wave decline determines that the larger trend is down. Why is this information important? Because it is easier to trade in the direction of the overriding trend, since it is the path of least resistance and undoubtedly explains the saying, “the trend is your friend.” Simply put, the probability of a successful commodity trade is much greater if a trader is long Soybeans when the other grains are rallying.
2. Identifies Countertrend – The Wave Principle also identifies countertrend moves. The three-wave pattern is a corrective response to the preceding impulse wave. Knowing that a recent move in price is merely a correction within a larger trending market is especially important for traders, because corrections are opportunities for traders to position themselves in the direction of the larger trend of a market.
3. Determines Maturity of a Trend – As Elliott observed, wave patterns form larger and smaller versions of themselves. This repetition in form means that price activity is fractal, as illustrated in Figure 1. Wave (1) subdivides into five small waves, yet is part of a larger five-wave pattern. How is this information useful? It helps traders recognize the maturity of a trend. If prices are advancing in wave 5 of a five-wave advance for example, and wave 5 has already completed three or four smaller waves, a trader knows this is not the time to add long positions. Instead, it may be time to take profits or at least to raise protective stops.
Since the Wave Principle identifies trend, countertrend, and the maturity of a trend, it’s no surprise that the Wave Principle also signals the return of the dominant trend. Once a countertrend move unfolds in three waves (A-B-C), this structure can signal the point where the dominant trend has resumed, namely, once price action exceeds the extreme of wave B. Knowing precisely when a trend has resumed brings an added benefit: It increases the probability of a successful trade, which is further enhanced when accompanied by traditional technical studies.
Read the rest of this 5-page Trader’s Classroom Collection lesson now, free! Learn more here.
Here’s what you’ll learn:
- How the Wave Principle provides you with price targets
- How it gives you specific “points of ruin”: At what point does a trade fail?
- What specific trading opportunities the Wave Principle offers you
- How to use the Wave Principle to set protective stops
- Keep reading this free lesson now.
Robert Prechter, Chartered Market Technician, is the world’s foremost expert on and proponent of the deflationary scenario. Prechter is the founder and CEO of Elliott Wave International, author of Wall Street best-sellers Conquer the Crash and Elliott Wave Principle and editor of The Elliott Wave Theorist monthly market letter since 1979.