Declining Volume Signals Market Trouble
The three-and-a-half-year rally has occurred on declining volume
What a comeback for the Dow Industrials! From a March 9, 2009, close of 6,547, the senior index climbed to 13,610 on Oct. 5, 2012. Moreover, the Dow achieved this feat in the face of a weak-kneed economy, and it has grinded forward now for three and a half years. The persistent rise has emboldened stock market prognosticators.
S&P Could Still Hit 1,600 Year-End
–CNBC, Oct. 23
All the while, fewer and fewer investors have been participating in the so-called recovery.
Take a look at the chart below from the just-published October 2012 special videoElliott Wave Theorist, and then read Prechter’s commentary.
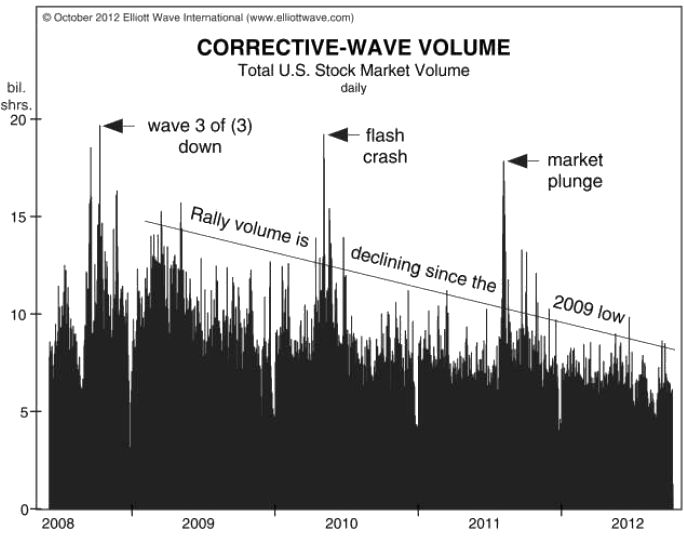
People have started ignoring volume because bears have been talking about declining volume ever since 2010. But it is extremely important. Volume overall has been shrinking ever since the market’s low of March 2009. This line that I’ve drawn tracks the volume on the rising portions of the rally from 2009. Every time the market gets hit very hard-such as in the collapse of 2008, the “flash crash” of May 2010 and the market plunge in August last year-volume picks up.
This is not a picture of a bull market. In a bull market, the opposite happens. Volume should be going up during the entire period, and it should be declining every time the market corrects. But we’re getting exactly the opposite situation.
—The Elliott Wave Theorist, October 2012
Volume is an important momentum indicator that many overlook. It’s time to start looking at your investments independently. EWI is here to help.
 |
Learn to Think Independently
You’ll get some of the most groundbreaking and eye-opening reports ever published in Elliott Wave International’s 30-year history; you’ll also get new analysis, forecasts and commentary to help you think independently in today’s tumultuous market. Download Your Free 50-Page Independent Investor eBook Now >> |