Using Moving Averages in Trading
A moving average, in finance and especially in technical analysis, is one of a family of similar statistical techniques used to analyze time series data.
A moving average series can be calculated for any time series, but is most often applied to stock prices, returns or trading volumes. Moving averages are used to smooth out short-term fluctuations, thus highlighting longer-term trends or cycles. The threshold between short-term and long-term depends on the application, and the parameters of the moving average will be set accordingly.
Mathematically, each of these moving averages is an example of a convolution. These averages are also similar to the low-pass filters used in signal processing.
Simple moving average
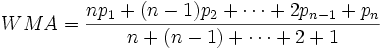
A simple moving average is the unweighted mean of the previous n data points. For example, a 10-day simple moving average of closing price is the mean of the previous 10 days’ closing prices. If those prices are p1 to pn then the formula is
When calculating successive values, a new value comes into the sum and an old value drops out, meaning a full summation each time is unnecessary,
In technical analysis there are various popular values for n, like 10 days, 40 days, or 200 days. The period selected depends on the kind of movement one is concentrating on, such as short, intermediate, or long term. In any case moving average levels are interpreted as support in a rising market, or resistance in a falling market.
In all cases a moving average lags behind the latest price action, simply from the nature of its smoothing. An SMA can lag to an undesirable extent, and can be influenced too much by old prices dropping out of the average. This is addressed by giving extra weight to recent prices, as in the WMAand EMA below.
One characteristic of the SMA is that if the data has a periodic fluctuation, then applying an SMA of that period will eliminate that variation (the average always containing one complete cycle). But a perfectly regular cycle is rarely encountered in economics or finance.
Weighted moving average
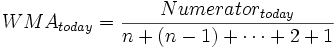
A weighted average is any average that has multiplying factors to give different weights to different data points. But in technical analysis a weighted moving average (WMA) has the specific meaning of weights which decrease arithmetically. In an n-day WMA the latest day has weight n, the second latest n-1, etc, down to zero.
When calculating the WMA across successive values, it can be noted an amount p2 to pn + 1 drops out of the numerator each day. The WMA can thus be calculated starting with the above formula but then stepping successively with just additions and subtractions, not a full set of multiplications,
- Totaltoday = Totalyesterday + p1 −- pn + 1
- Numeratortoday = Numeratoryesterday + np1 −- Totalyesterday
The denominator, incidentally, is a triangle number, and equals
The graph at the right shows how the weights decrease, from highest weight for the most recent days, down to zero. It can be compared to the weights in the exponential moving average which follows.
Exponential moving average
An exponential moving average (EMA), sometimes also called an exponentially weighted moving average (EWMA), applies weighting factors which decrease exponentially. The weighting for each day decreases by a factor, or percentage, on the one before it. The graph at right shows an example of the decrease.
There are two ways to express the decrease, both result in a smoothing factor αa. Firstly as a percentage so 10% is α=0.1. Or alternately as N periods where ![]() , so for instance N=19 is equivalent to the 10%. In either case the formula for calculating successive days is
, so for instance N=19 is equivalent to the 10%. In either case the formula for calculating successive days is
Which can also be rewritten as follows, showing how the EMA steps towards the latest price, but only by a proportion of the difference (each time),
Expanding out EMAyesterday each time results in the following power series, showing how the weighting factor on each price p1, p2, etc, decrease exponentially,
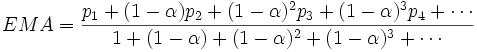
In theory this is an infinite sum, but because 1-α is less than 1, the terms become smaller and smaller, and can be ignored once small enough. The denominator approaches 1/α, and that value can be used instead of adding up the powers, provided one is using enough terms that the omitted portion is negligible.
The N periods in an N-day EMA only specifies the αa factor. It isn’t a stopping point for the calculation in the way N is in an SMA or WMA. The first N days in an EMA do represent about 86% of the total weight in the calculation though.
The power formula above gives a starting value for a particular day, after which the successive days formula shown first can be applied.
The question of how far back to go for an initial value depends, in the worst case, on the data. If there are huge p price values in old data then they’ll have an effect on the total even if their weighting is very small. If one assumes prices don’t vary too wildly then just the weighting can be considered, and work out how much weight is omitted by stopping after say k terms. This is ![]() , which is
, which is ![]() , ie. a fraction (1 − α)k out of the total weight.
, ie. a fraction (1 − α)k out of the total weight.
Thus if the aim was to have 99.9% of the weight then ![]() many terms should be used. And what’s more it can be shown
many terms should be used. And what’s more it can be shown ![]() approaches
approaches ![]() as N increases, so this simplifies to (roughly)
as N increases, so this simplifies to (roughly) ![]() for this example 99.9% weight.
for this example 99.9% weight.
J. Welles Wilder
Noted technical analyst J. Welles Wilder uses a different form for specifying the period of an EMA. For say 14 days he writes
So α=1/N rather than α=2/(N+1) as described above. The calculation and properties are all the same, it’s just a different reckoning of the rate of smoothing. Clearly care must be taken with which is intended. A conversion can be easily made, for instance 14-days from Wilder is equivalent to 27-days in the above (conversion 2N-1).
Other weightings
Other weighting systems are used occasionally – for example, a volume weighting will weight each time period in proportion to its trading volume.
There are weighting systems designed using a combination of moving averages: The DEMA indicator (and TEMA indicator (Triple Exponential Moving Average) are unique composites of a single exponential moving average, a double exponential moving average, and in the latter case a triple exponential moving average that provides less lag than either of the three components individually. They were originally introduced January 1994 by Patrick Mulloy.
The TRIX indicator uses a triple-EMA in its calculation. This ends up as just a certain set of weights on past data, and a set quite different to a plain EMA actually.
High-Confidence Trading Opportunities Using Moving Averages
Free 10-page eBook can get you started
The moving average is a technical indicator which has stood the test of time. It’s been 27 years since Robert Prechter described this vital tool in his famous essay, “What a Trader Really Needs to be Successful.” What he said then remains true today:
A simple 10-day moving average of the daily advance-decline net, probably the first indicator a stock market technician learns, can be used as a trading tool, if objectively defined rules are created for its use.
What is a moving average? Here’s how EWI’s Jeffrey Kennedy puts it:
A moving average is simply the average value of data over a specified time period, and it is used to figure out whether the price of a stock or commodity is trending up or down.
He also says that you can think of a moving average as an automated trend line.
A 20-year veteran of technical analysis, Jeffrey wrote “How You Can Find High-Probability Trading Opportunities Using Moving Averages.”
[Descriptions of the following charts are summaries from that eBook]:
Let’s begin with the most commonly-used moving averages among market technicians: the 50- and 200-day simple moving averages. These two trend lines often serve as areas of resistance or support.
For example, the chart below shows the circled areas where the 200-period SMA provided resistance in an April-to-May, 2008 upward move in the DJIA (top circle on the heavy black line), and the 50-period SMA provided support (lower circle on the blue line).
Let’s look at another widely used simple moving average which works equally well in commodities, currencies, and stocks: the 13-period SMA.
In the sugar chart below, prices crossed the line (marked by the short, red vertical line), and that cross led to a substantial rally. This chart also shows a whipsaw in the market, which is circled.
Another popular moving average setting that many people work with is the 13- and the 26-period moving averages in tandem.
The chart of Johnson and Johnson shows a crossover system using a 13-week and a 26-week simple moving average of the close. Obviously, the number 26 is two times 13. During this four-year period, the range in this stock was a little over $20.00, which is not much price appreciation. This dual moving average system worked well in a relatively bad market by identifying a number of buyside and sellside trading opportunities.


 |
You can read the first two chapters of this eBook FREE for a limited time.
The first two chapters reveal:
Jeffrey’s insights are all about helping you become a better trader. Remember, the first two eBook chapters are FREE, so take advantage of this limited-time offer. |
This article was syndicated by Elliott Wave International and was originally published under the headline Spot High-Confidence Trading Opportunities Using Moving Averages. EWI is the world’s largest market forecasting firm. Its staff of full-time analysts led by Chartered Market Technician Robert Prechter provides 24-hour-a-day market analysis to institutional and private investors around the world.
How Moving Averages Can Alert You to Future Price Expansions
To a first-time observer, watching a technical analyst spot a major trend change in a financial market before it occurs can seem as mystical as pulling a rabbit out of hat. But once you learn the tools of the trade, you know there are no tricks up the technical analyst’s sleeve. What you see, is exactly what you get.
On this, EWI’s Senior Commodities Analyst Jeffrey Kennedy speaks to one technical indicator in particular: moving averages. In Jeffrey’s own words:
- “There is no magic in moving averages, the magic comes in finding something that you are comfortable with and applying it. I like it because it consistently works and you can customize it to your individual trading style and time frame.”
Jeffrey’s appreciation of the measure doesn’t end there. In his highly acclaimed Commodity Trader’s Classroom eBook, Jeffery expands on the many variations of MA analysis used to identify high probability trade set-ups. Among his favorites: the Moving Average Compression. The excerpt below is a direct quote from Jeffrey’s eBook:
“Moving Average Compression works so well in identifying trade set-ups because it represents periods of market contraction. As we know, because of the Wave Principle, after markets expand, they contract (when a five-wave move is complete, prices retrace a portion of this move in three waves.) MAC alerts you to those periods of price contraction. And since this state of price activity can’t be sustained, MAC is also the precursor to price expansion.
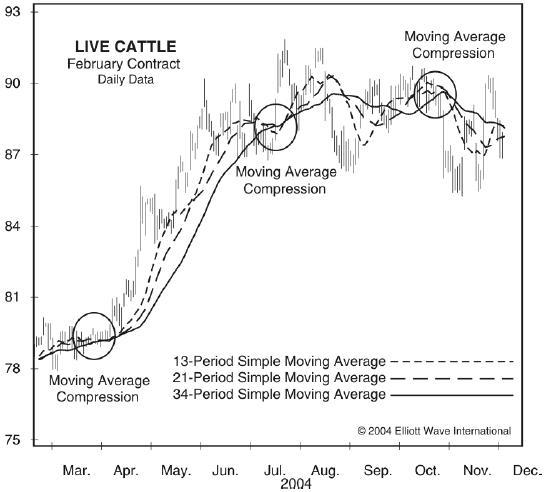 |
The Live Cattle chart above demonstrates three different simple moving averages based on Fibonacci numbers 13, 21 and 34. The point at which all of the moving averages become one and form a straight line is what Jeffrey refers to as Moving Average Compression. As you can see, the compression of the moving averages tells us that the market has contracted, and prompts the expansion shown in April and May 2004.”
|