Why a U.S. Recession May Foil Economists’ Expectations
“Many classic indicators of a recession are exactly where they were at the…”
You may have heard that Germany has slipped into a recession.
What you may not have heard is, the German government anticipated an economic uptick in Q1, not a slide.
Reality failing to meet expectations may extend beyond the German economy. A similar scenario could play out in the U.S.
Here’s what I mean: The Federal Reserve Bank of Philadelphia’s Second Quarter survey revealed that the average expectation of 38 “professional forecasters” is for real GDP growth of 1.3% in 2023.
Perhaps these professionals have not taken a hard look at some key leading economic indicators, or if they have, they interpret them differently than Elliott Wave International.
Specifically, the just-published June Elliott Wave Financial Forecast, which covers major U.S. financial markets and the economy, showed this chart and said:
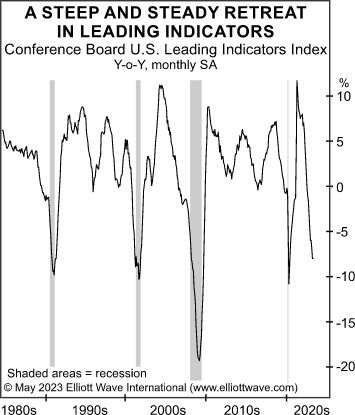
Many classic indicators of a recession are exactly where they were at the beginning of past recessions. In fact, the year-over-year change in the Conference Board’s Leading Indicators Index, which includes 10 different measures, is at -8% … similar readings came near the outset, or in, each of the last four recessions. In April, just three out of ten indicators were positive. … A 4% decline in the LEI index signals a recession, according to the Conference Board, so the majority of economists are clearly bucking history.
Now, one of the three of ten indicators that are positive is the S&P 500.
What are the expectations for this index?
Here’s a May 8 headline from Marketwatch:
S&P 500 could rise as high as 4,400 in coming months, says Wall Street strategist who called 2023’s rebound
Yes, big technology names helped to carry the S&P 500 higher. And this strategist might turn out to be right about the future performance of the index.
However, it might be a good idea to check out what the Elliott waves are saying about the stock market. After all, the performance of the economy tends to follow the performance of the stock market.
If you’d like to learn how to analyze the stock market using Elliott waves, read Frost & Prechter’s Elliott Wave Principle: Key to Market Behavior. Here’s a quote from this Wall Street classic:
The “right look” of a wave is dictated by all the considerations we have outlined so far in the first two chapters. In our experience, we have found it extremely dangerous to allow our emotional involvement with the market to let us accept a wave count that reflects disproportionate wave relationships or a misshapen pattern merely on the basis that the Wave Principle’s patterns are somewhat elastic.
[R.N.] Elliott cautioned that “the right look” may not be evident at all degrees of trend simultaneously. The solution is to focus on the degrees that are clearest. If the hourly chart is confusing, step back and look at the daily or weekly chart. Conversely, if the weekly chart offers too many possibilities, concentrate on the shorter term movements until the bigger picture clarifies. Generally speaking, you need short term charts to analyze subdivisions in fast moving markets and long term charts for slowly moving markets.
Would you like to read the entire online version of Elliott Wave Principle: Key to Market Behavior for free?
If your answer is “yes,” you may do so once you join Club EWI, the world’s largest Elliott wave educational community. You can join Club EWI without any obligations and membership is free. Do know that Club EWI members enjoy access to a wealth of Elliott wave resources on financial markets, investing and trading. Some videos and articles are from Elliott Wave International’s analysts.
Sign up for a Club EWI membership now to start enjoying the benefits. Just follow this link: Elliott Wave Principle: Key to Market Behavior — get free and instant access.