Stock Market Long Term Returns
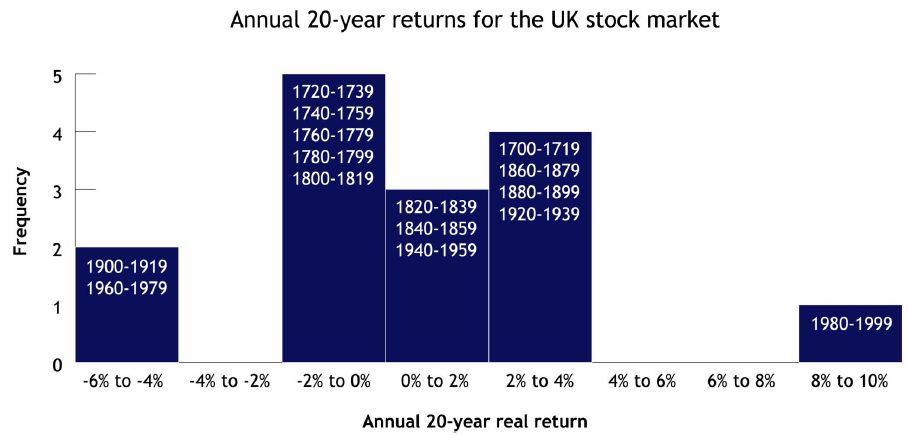
Below is a chart that shows the historic returns, adjusted for inflation, for the UK market for the last 200 years. It speaks for itself. It looks like a bell curve which shows the highest probable return for the stock market is -2% to +4%. If your 401k is long heavily in stocks based on common wisdom of this age, you may be betting that the 1 in 15 chance on the very right edge of the graph will happen again.
 |
Source: http://seekingalpha.com/article/146891-triumph-of-the-market-realists#comment-641432
If you understand the current investment environment, it helps you to make informed decisions which will protect your wealth and increase your market returns, and perhaps avoid major disasters along the way.
Investing in the Stock Market
The old adage says, “you are what you eat,” and today we’re offering you a heaping portion of brain food.
See if you can answer these four questions:
In 1950, a good computer cost $1 million. In 1990, it cost $5000. Today it costs $1000.
Question: What will a good computer cost 50 years from today?
Democracy as a form of government has been spreading for centuries. In the 1940s, Japan changed from an empire to a democracy. In the 1980s, the Russian Soviet system collapsed, and now the country holds multi-party elections. In the 1990s, China adopted free-market reforms. In March of this year, Iraq, a former dictatorship, celebrated a new democratic constitution.
Question: Fifty years from today, will a larger or smaller percentage of the world’s population live under democracy?
In the decade from 1983 to 1993, there were ten months of recession in the U.S.; in the subsequent decade from 1993 to 2003, there were 8 months of recession. In the first period, expansion was underway 92 percent of the time; in the second period, it was 93 percent.
Question: What percentage of the time will expansion take place during the decade from 2003 to 2013?
In 1970, Reserve Funds kicked off the hugely successful money market fund industry. In 1973, the CBOE introduced options on stocks. In 1977, Michael Milken invented junk bond financing, which became a major category of investment. In 1982, stock index futures and options on futures began to trade. In 1983, options on stock indexes became available. Keogh plans, IRAs and 401k’s have brought tax breaks to the investing public. The mutual fund industry, a small segment of the financial world in the late 1970s, has attracted the public’s invested wealth to the point that there are more mutual funds than there are NYSE stocks. Futures contracts on individual stocks have just begun trading.
Question: Over the next 50 years, will the number and sophistication of financial services increase or decrease?
Observe that I asked you a microeconomic question, a political question, a macroeconomic question and a financial question.
Trend Extrapolation
If you are like most people, you extrapolated your answers from the trends of previous data. You expect cheaper computers, more democracy, an economic expansion rate in the 90-95 percent range, and an increase in financial sophistication.
It appears sensible to answer such questions by extrapolation because people default to physics when predicting social trends. They think, “Momentum will remain constant unless acted on by an outside force.” This mode of thought is deeply embedded in our minds because it has tremendous evolutionary advantages. When Og threw a rock at Ugg back in the cave days, Ugg ducked. He ducked because his mind had inherited and/or learned the consequences of the Law of Conservation of Momentum. The rock would not veer off course because there was nothing between the two men to act upon it, and rocks do not have minds of their own. Earlier animals that incorporated responses to the laws of physics lived; those that didn’t died, and their genes were weeded out of the gene pool. The Law of Conservation of Momentum makes possible our modern technological world. People rely on it every day. Despite its use in so many areas, however, it is inapplicable to predicting social change. For most people in most circumstances, the proper answer to each of the above questions is, “I don�t know.” (Socionomics can give you an edge in social prediction, but that’s another story.)
The most certain aspect of social history is dramatic change. To get a feel for how useless — even counterproductive — extrapolation can be in social forecasting, consider these questions.
It is 1886. Project the American railroad industry.
It is 1970. Project the future of China.
It is 1963. Project the cost of medical care in the U.S.
It is 1969. Project the U.S. space program.
It is 100 A.D. Project the future of Roman civilization.
In 1886, you would have envisioned a future landscape combed with rail lines connecting every city, town and neighborhood. Small trains would roll around to your home to pick you up, and a network of rail lines would help deliver you to your destination efficiently and cheaply. Super-fast trains would make cross-country runs. You could eat, read or sleep along the way.
Is that what happened? Would anyone have predicted, indeed did anyone predict, that trains in 2004 would often be going slower than they did in 1886, that they would routinely jump the tracks, that they would be inefficient, that they would have little food and few sleeper cars, that the equipment would be old and worn out?
In 1970, the Communist party was entrenched in China. Over 35 million people had been slaughtered, culminating in the Cultural Revolution in which Chinese youths helped exterminate people just because they were smart, successful or capitalist. Would anyone have imagined that China, in just over a single generation, would be out-producing the United States, which was then the world’s premier industrial giant?
In 1963, medical care was cheap and accessible. Doctors made house calls for $20. Hospitals were so accommodating that new mothers typically stayed for a week or more before being sent home, and it was affordable. Would anyone have guessed that forty years later, pills would sell for $2 apiece, a surgical procedure and a week in the hospital could cost one-third of the average annual wage, and people would have to take out expensive insurance policies just in case they got sick?
In the space of just 30 years, rockets had gone from the experimental stage to such sophistication that one of them brought men to the moon and back. In 1969, many people projected the U.S. space program over the next 30 years to include colonies on the moon and trips to Mars. After all, it was only sensible, wasn’t it? By the laws of physics, it was. But in the 35 years since 1969, the space program has relentlessly regressed.
In 100 A.D., would you have predicted that the most powerful culture in the world would be reduced to rubble in a bit over three centuries? If Rome had had a stock market, it would have gone essentially to zero.
Futurists nearly always extrapolate past trends, and they are nearly always wrong. You cannot use extrapolation under the physics paradigm to predict social trends, including macroeconomic, political and financial trends. The most certain aspect of social history is dramatic change. More interesting, social change is a self-induced change. Rocks cannot change trajectory on their own, but societies can and do change direction, all the time.
Action and Reaction
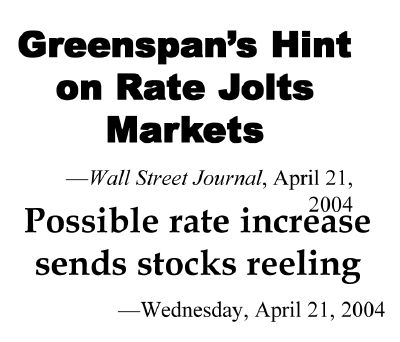
In the world of physics, action is followed by reaction. Most financial analysts, economists, historians, sociologists and futurists believe that society works the same way. They typically say, “Because so-and-so has happened, such-and-such will follow.” The news headlines in Figure 1, for example, reflect what economists tell reporters: Good economic news makes the stock market go up; bad economic news makes it go down. But is it true?
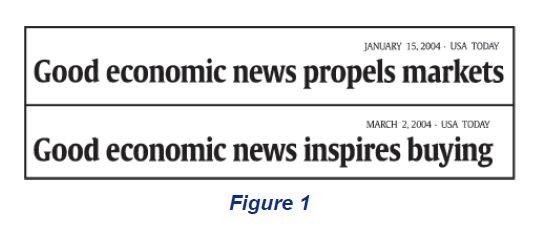 |
Figure 2 shows the Dow Jones Industrial Average and the quarter-by-quarter performance of the U.S. economy. Much of the time, the trends are allied, but if physics reigned in this realm, they would always be allied. They aren’t. The fourth quarter of 1987 saw the strongest GDP quarter in a 15-year span (from 1984 through 1999). That was also the biggest down quarter in stock prices for the entire period. Action in the economy did not produce reaction in stocks. The four-year period from March 1976 to March 1980 had not a single down quarter of GDP and included the biggest single positive quarter for 20 years on either side. Yet the DJIA lost 25 percent of its value during that period. Had you known the economic figures in advance and believed that financial laws are the same as physical laws, you would have bought stocks in both cases. You would have lost a lot of money.
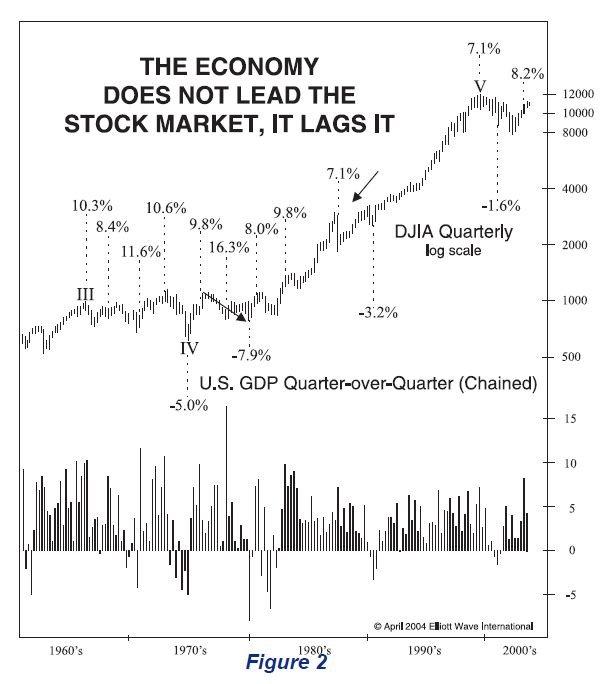 |
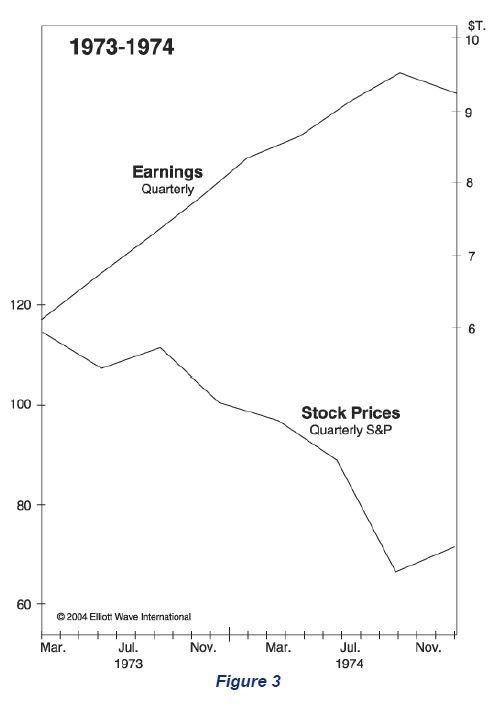
Figure 3 shows the S&P against quarterly earnings in 1973-1974. Did action in earnings produce reaction in the stock market? Not unless you consider rising earnings bad news. While earning rose persistently in 1973-1974, the stock market had its biggest decline in over 40 years.
 |
Suppose you knew for certain that inflation would triple the money supply over the next 20 years. What would you predict for the price of gold? Most analysts and investors are certain that inflation makes gold go up in price. They view financial pricing as simple action and reaction, as in physics. They reason that a rising money supply reduces the value of each purchasing unit, so the price of gold, which is an alternative to money, will reflect that change, increment for increment.
Figure 4 shows a time when the money supply tripled yet gold lost over half its value. In other words, gold not only failed to reflect the amount of inflation that occurred but also failed even to go in the same direction. It failed the prediction from physics by a whopping factor of six, thereby unequivocally invalidating it. (I was generous in ending the study now rather than in 2001, at which time gold had lost over two-thirds of its value.)
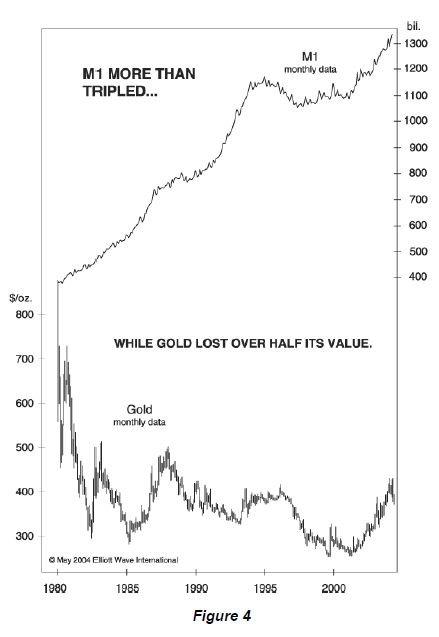 |
It does no good to say — as we sometimes hear from those attempting to rescue the physics paradigm in finance — that gold will follow the money supply “eventually.” In physics, billiard balls on an endless plane do not eventually return to a straight path after wandering all over the place, including in the reverse direction from the way they are hit. (What physics-minded investor, moreover, can be sure that gold should follow the money supply rather than vice versa? Is he certain which element in the picture should be presumed to be the action and which the reaction? Maybe a higher gold price increases the value of central banks’ gold reserves, letting them support more lending. Cause and effect arguments are highly manipulable when using the physics paradigm.)
We do know one thing: Investors who feared inflation in January 1980 were right, yet they lost dollar value for two decades, lost even more buying power because the dollar itself was losing value against goods and services, and lost even more wealth in the form of missed opportunities in other markets. Gold’s bear market produced more than a 90 percent loss in terms of gold’s average purchasing power of goods, services, homes and corporate shares despite persistent inflation! How is such an outcome possible? Easy: Financial markets are not a matter of action and reaction. The physics model of financial markets is wrong.
|

Cause and Effect
In the 1990s, a university professor sold many books that made a case for buying “stocks for the long run.” In a recent issue of USA Today, he told a reporter, “Clearly, the risk of terror is the major reason why the markets have come down. We can’t quantify these risks; it’s not like flipping a coin and knowing your odds are 50-50 that an attack won’t occur.”
In other words, he accepts the physics paradigm of external cause and effect with respect to the stock market but says he cannot predict the cause part of the equation and therefore cannot predict stock prices. The first question is, well, if one cannot predict causes, then how can one write a book predicting effects, i.e., arguing that stocks will go up? Or down or sideways? A second question is far more important. We have already seen that economic performance, earnings and inflation do not necessarily coincide with movements in apparently related financial markets. In fact, the two sets of data can utterly oppose each other. Is there any evidence that dramatic news events that make headlines, such as terrorist attacks, political events, wars, crises or any such events are causal to stock market movement?
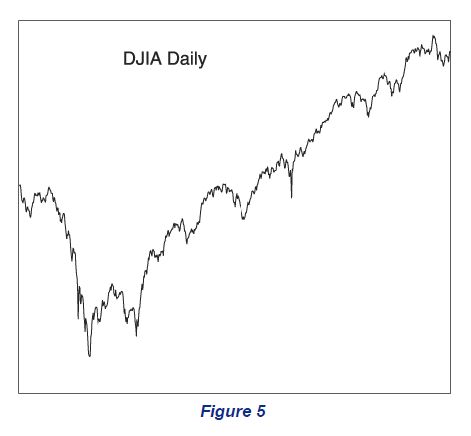
Suppose the devil were to offer you historic news a day in advance. He doesn’t even ask for your soul in exchange. He explains, “What’s more, you can hold a position for as little as a single trading day after the event or as long as you like.” It sounds foolproof, so you accept. His first offer: “The president will be assassinated tomorrow.” You can’t believe it. You and only you know it’s going to happen. The devil transports you back to November 22, 1963. You short the market. Do you make money?
Figure 5 shows the DJIA around the time when President John Kennedy was shot. First of all, can you tell by looking at the graph exactly when that event occurred? Maybe before that big drop on the left? Maybe at some other peak, causing a selloff?
 |
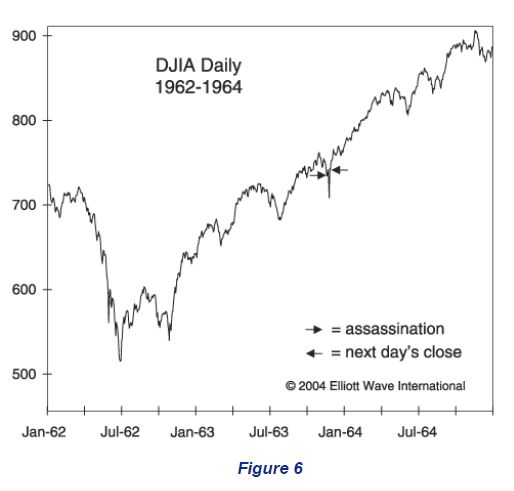
The first arrow in Figure 6 shows the timing of the assassination. The market initially fell, but by the close of the next trading day, it was above where it was at the moment of the event, as you can see by the second arrow. You can’t cover your short sales until the following day’s up opening because the devil said that you could hold as briefly as one trading day after the event, but not less. You lose money.
 |
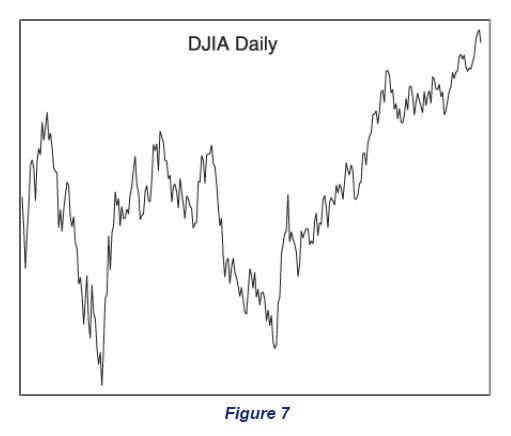
You aren’t really angry because after all, the devil delivered on his promise. Your only error was to believe that a presidential assassination would dictate the course of stock prices. So you vow not to bet on things that aren’t directly related to finance. The devil pops up again, and you explain what you want. “I’ve got just the thing,” he says, and announces, “The biggest electrical blackout in the history of North America will occur tomorrow.” Wow. Billions of dollars of lost production. People stranded in subways and elevators. The last time a blackout occurred, there was a riot in New York and hundreds of millions of dollars’ worth of damage done. How more directly related to finance could you get? “Sold!” you cry. The devil transports you back to August 2003.
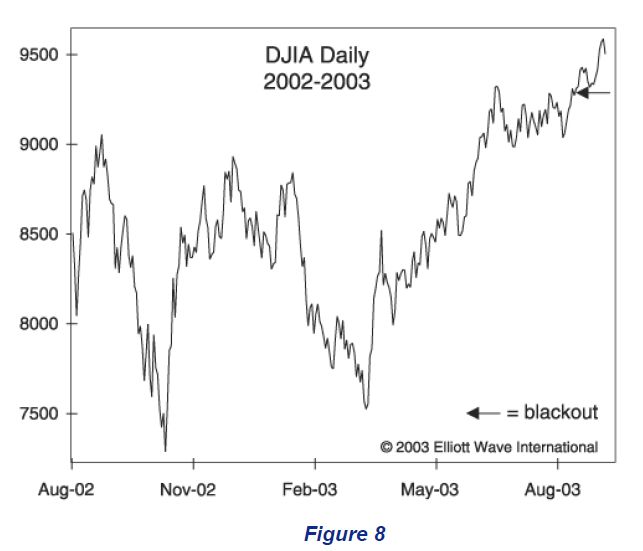
Figure 7 shows the DJIA around the time of the blackout. Does the history of stock prices make it evident when that event occurred? After all, if markets are action and reaction, then this economic loss should show up unmistakably, shouldn’t it? There are two big drops on the graph. Maybe it’s one of them.
 |
The arrow in Figure 8 shows the timing of that event. Not only did the market fail to collapse, it gapped up the next morning! You sit all day with your short sales and cover the following day with another loss.
 |
“Third time’s the charm,” says the devil. You reply, “Forget it. I don’t understand why the market isn’t reacting to these causes. Maybe these events you’re giving me just aren’t strong enough.” The devil leans into your ear and whispers, “Two bombs will be detonated in London, leveling landmark buildings and killing 3000 people. Another bomb planted at Parliament will misfire, merely blowing the side off the building. The terrorist perpetrators will vow to continue their attacks until England is wiped out.” He promises that you can sell short on the London Stock Exchange ten minutes before it happens and even offers to remove the one-day holding restriction. “Cover whenever you like,” he says. You agree. The devil then transports you to a parallel universe where London is New York and Parliament is the Pentagon. It’s September 11, 2001.
Figure 9 shows the DJIA around that time. Study it carefully. Can you find an anomaly on the graph? Is there an obvious time when the shocking events of “9/11” show up? If markets reacted to “exogenous shocks,” as billiard balls do, there would be something obviously different on the graph at that time, wouldn’t there? But there isn’t.
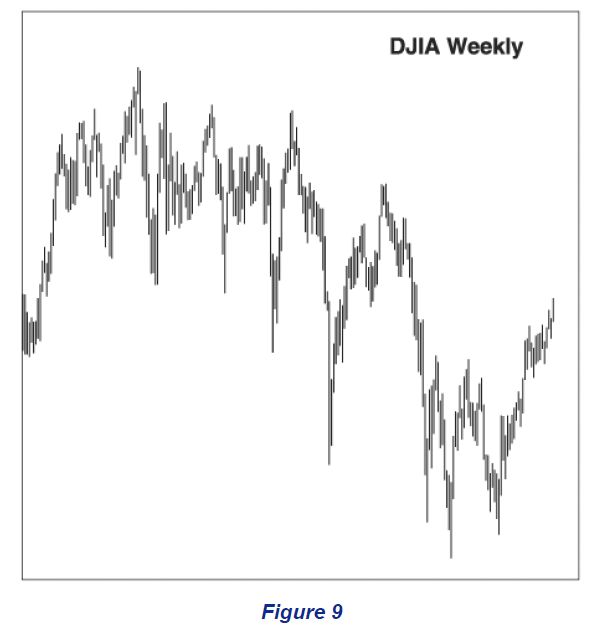 |
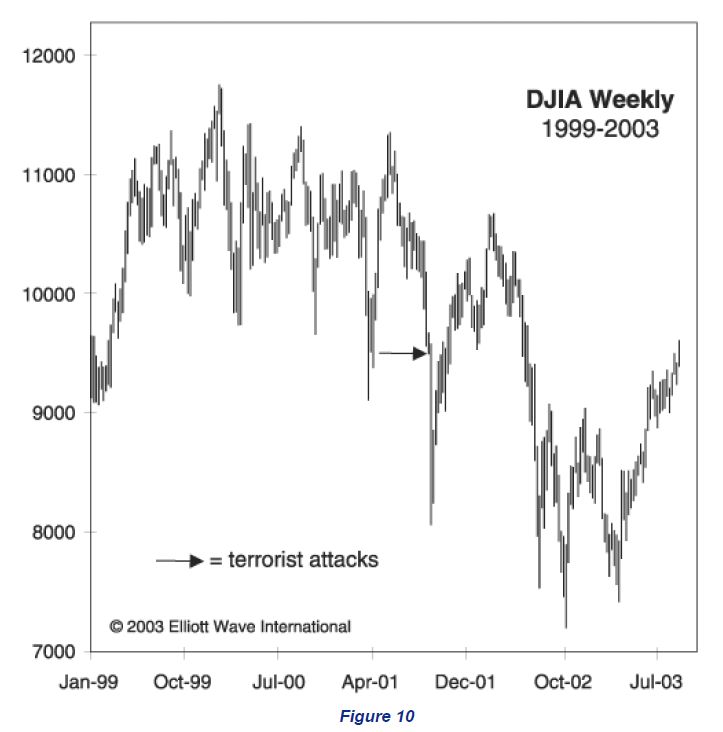
Figure 10 shows the timing of the 9/11 terrorist attacks. You may recall that authorities closed the stock market for four trading days plus a weekend. Question: Was it a certainty that the market would re-open on the downside? No! Some popular radio talk-show hosts and administration officials advocated buying stocks on the opening just to “show ’em.” You sit with your massive short position, and you are nervous. But you are also lucky. The market opens down, continuing a decline that had already been in force for 17 weeks. You cheer. You’re making money now! Well, you do for six days, anyway. Then the market leaps higher, and somewhere between one week and six months later you finally cover your shorts at a loss, disgusted and confused. If you are an everyday thoughtful person, you decide that events are irrelevant to markets and begin the long process of educating yourself on why markets move as they do. If you are a conventional economist, you don’t bother.
 |
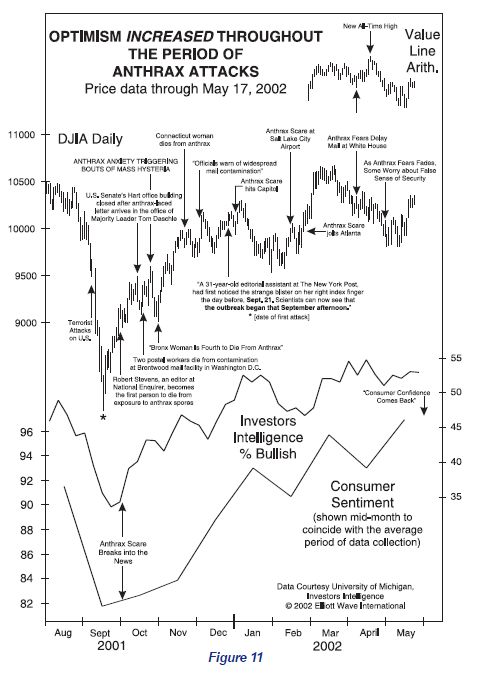
In case you still think that terrorism is a factor somewhere in the falling markets of 2000-2002, please read “Challenging the Conventional Assumption About the Presumed Sociological Effect of Terrorist News,” which is reprinted in Pioneering Studies in Socionomics. It shows unequivocally that the terrorist events and related fears of that time encompassed a period when the market mostly went up and consumer sentiment improved. The graph that accompanies that study is reproduced here as Figure 11.
 |
Now think about this: In real life, you don’t get to know about dramatic events in advance. Investors who sold stocks upon hearing of the various events cited above did so because they believed that events cause changes in stock values. They all sold the low. I chose bad news for these exercises because it tends to be more dramatic, but the same irrelevance attaches to good news.
Since knowing dramatic events in advance would produce no value for investing, guessing events is an utter waste of time. There are no “inefficiencies” related to external causality that one may exploit.
If news is irrelevant to markets, how can the media explain almost every day’s market action by the news? Answer: There is a lot of news every day. Commentators don’t write their cause-and-effect stories before the session starts but after it ends. It’s no trick to fit news to the market after it’s closed. I am writing this paragraph the day after stocks had a big down day. The news at 8:30 a.m. yesterday was good, a “stronger-than-expected 1.8 percent jump in March retail sales.” How, then, did this morning’s newspaper, relying on cause and effect, explain yesterday’s big drop? (Remember, it’s easy to play games with cause and effect under the physics paradigm.) Here is the headline: “Rising-Rates Scenario Sends Stocks Reeling.”2 This and other articles present the following ex-post-facto consensus reasoning: Investors appear to have decided that the good news that the economy is “starting to accelerate” might mean higher interest rates, which would be bearish if it happened. This contrived conclusion is doubly bizarre given the century-long history of interest-rate data, which (as the next section will show) belies such a belief. How, moreover, does one explain the fact that the stock market opened higher yesterday, in concert with the standard view of such news being “good”? There was no more big news that day. Had there been some “bad” news immediately after the opening, such inventive reasoning would not have been required. The “reason” for the rout would have been obvious, just as it was on the previous down day of this size, on which terrorists conveniently bombed trains in Spain. (Let me guess. You think that this example of news causality makes sense, don’t you? Sorry. Did I mention that the U.S. stock market — fully apprised of the news — rallied until noon that day before selling off?)
|
Another Example of Rationalization, Ripped from the Headlines
Almost every day brings another example of rationalization in defense of the idea that news moves markets. The stock market rallied for half an hour on the morning of April 20, peaked at 10:00 a.m., and sold off for the rest of the day. Almost every newspaper and wire service claims that the market sold off because “Greenspan told Congress that the nation’s banking system is well prepared to deal with rising rates, which the market interpreted as a new signal the Fed will tighten its policy sooner rather than later.”3 Is this explanation plausible?
 Point #1: Greenspan began speaking around 2:30, but the market had already peaked at 10:00.
Point #2: Greenspan said something favorable about the banking system, not unfavorable about rates. A caption in The Wall Street Journal reads, “Greenspan smiles, markets don’t.”4 The real story here is that the market went down despite his upbeat comments, not because of them.
Point #3: Greenspan’s speech was not the only news available. Most of the other news that day was good as well. As the AP reported, profits of corporations were good and “most economists don’t expect the Fed to raise rates at its next meeting.” So if news were causal, then on balance the market should have risen.
Point #4: The Fed’s interest rate changes lag the market’s interest rate changes. Interest rates had moved higher for months. Even if Greenspan had stated (which he didn’t) that the Fed would raise its Federal Funds rate immediately, it would have been no surprise.
Point #5: Greenspan said nothing that people didn’t already know, so while the fact of the speech was news, there was no news in the content of the speech.
Point #6: The simultaneously reported fact that “most economists don’t expect the Fed to raise rates at its next meeting” contradicts the argument for why investors sold stocks. If economists don’t believe it, why should we think that anyone else does?
Point #7: Greenspan did not say that rates would go up.
Point #8: We have no data on the history of stock market movement following mere hints of a possible rates rise, which means no data on which commentators could justifiably base an explanation of the market’s apparent reaction to such a hint, if in fact there was one.
Point #9: There is no evidence that a rise in interest rates makes the stock market go down. In 1992, the Federal Funds rate was 3 percent. In December 1999, it was 5.5 percent. The Dow didn’t go down during that time; it tripled. Rates also rose from the late 1940s to the late 1960s, during almost all of which time there was a huge bull market. Ned Davis Research has done the research and found that in the 22 instances of a single rate hike since 1917, “the Dow was always higher…whether three months, six months, one year or two years later.”5 In other words, if interest rates truly cause market movements, then a rate rise would be bullish. According to Davis, it takes a series of four to six rate increases to hurt the market, and that’s if you allow the supposed negative causality to appear up to twelve months later! So even accepting the bogus claim of causality would mean that investors would have had to read into Greenspan’s optimistic comment on the banking system a whole series of four to six rate rises, after which maybe the market would go down within a year after the final one! (The truth is that rising central-bank rates are usually a function of a strong economy, so many rate increases in a row simply mean that an economic expansion is aging, from which point a contraction eventually emerges naturally. Interest rates, like all other financial prices, are determined by the same society that determines stock prices. It’s all part of the flux within the same system. Changes in interest rates are not an external cause of stock price movements, just as stock price movements are not an external cause of changes in interest rates.)
So why did so many people conclude that Greenspan’s speech made the market go down? They didn’t conclude it from any applicable data; they just made it up. The range of errors required for people to concoct such “analysis” is immense, from an inapplicable chronology to contradictory facts to an utter lack of confirming data to a false underlying theory. Yet it happened; in fact, it happens every day.
Quiz: What does this sentence from the AP article mean? “Worries that interest rates will rise sooner rather than later have distracted investors from profit reports this earnings season.” Answer: It simply means, “The market went down today.” There is no other meaning in all those words.
Had the market instead gone up on April 20, commentators would simply have cited as causes the numerous optimistic statements in Greenspan’s address, i.e., “deflation is no longer an issue,” “pricing power is gradually being restored,” inflation is “reasonably contained,” labor productivity is “still impressive,” etc. There were, in fact, no — zero, none — negative statements about markets, the economy or the monetary climate in his address, which is why commentators — in order to maintain their belief in news causality — had to resort to such an elaborate rationalization to “explain” the day’s price action.
But wait. The market went up the next day, April 21. Let’s see what the explanation was then: Appearing this time before the Joint Economic Committee of Congress, Greenspan reiterated that interest rates “must rise at some point” to prevent an outbreak of inflation. But he added that “as yet,” the Fed’s policy of keeping interest rates low “has not fostered an environment in which broadbased inflation pressures appear to be building.” Analysts took that to mean the Fed might not be in such a hurry to raise short-term rates, the opposite of their reaction to his testimony to the Senate Banking Committee on Tuesday.
— The Atlanta Journal-Constitution, April 22, 20046
 We read that Greenspan “reiterated” his comments; in other words, he said essentially the same thing as the day before, yet investors “reacted” to the statements differently and did “the opposite” of what they had done the day before.
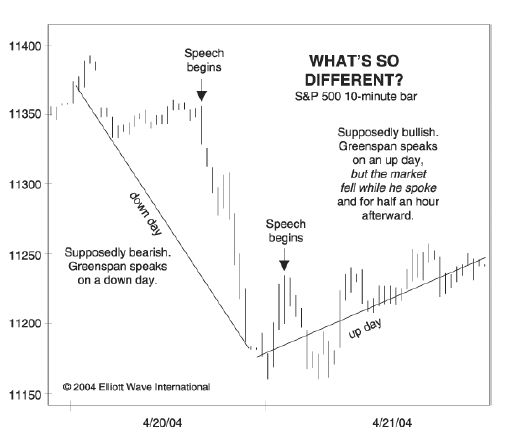
We know that this argument is false. How do we know? We know because once again we take the time to look at the data. Here is a 10-minute bar graph of the S&P 500 index for April 20 and 21. On it is shown the time that Greenspan was speaking. Observe that the market fell throughout his speech on April 21. It rallied after he was done. So his speech did not make the market close up on the day. It’s no good saying that there was a “delayed positive reaction,” because that’s not what happened the day before, when stocks were falling throughout the speech and for the rest of the day thereafter. Such ex-post-facto rationalization is common but never consistent. The conventional presumption of causality demanded an external force that made the market close up on the day, and, as usual, it manufactured one. An article that put the two days’ events side by side reveals how silly the causal arguments are:
NEW YORK — Stocks ended higher Wednesday despite Federal Reserve Chairman Alan Greenspan’s acknowledgment that short-term interest rates will have to be raised at some point. The gains came a day after stocks had sold off sharply when Greenspan said pricing power was improving for U.S. companies, sparking inflation fears.
— USA Today, April 22, 20047
One interviewee stated the (false) conventional premise: “Wall Street was in a less hysterical mood than yesterday with Fed Chairman Alan Greenspan being more expansive in his view of the economy,” i.e., the news changed investors’ mood. The socionomic view is different: People’s mood came first. Greenspan’s words did not make people calm or hysterical; people’s calm or hysterical moods induce them to buy or sell stocks, and then they rationalize why they did. Since there is no difference in the news items on these two days, our explanation makes more sense. It is also a consistent explanation, whereas news excuses are typically contradictory to past excuses and the data.
Those offering external-causality arguments, by the way, include economists and market strategists, people who supposedly spend their professional lives studying the stock market, interest rates and the economy. Yet even they barrel ahead on nothing but limbic impulses, sans data and sans correlation, because it seems to make sense. It does so because most people’s thinking simply defaults to physics when analyzing financial events. But when we take the time to examine the results of applying that model, we find that it is not useful either for predicting or explaining market behavior.
Another interesting aspect of financial rationalization is that in fact there is virtually never any evidence that people actually bought or sold stocks for the reasons cited. The fact that people actually sold stocks on April 20 or bought them on April 21 because of these long chains of causal reasoning is dubious at best. Had you asked investors during the rout why they were buying or selling, would they actually have cited either of these convoluted interest-rate arguments? I doubt it. Most people buy and sell because the social moods in which they participate impel them to buy and sell. A news event, any news event, merely provides a referent to occupy the naive neocortex while pre-rational herding impulses have their way.
This is what’s happening: When news seems to coincide sensibly with market movements, it’s just coincidence, yet people naturally presume a causal relationship. When news doesn’t fit the market, people devise an inventive cause-and-effect structure to make it fit the day’s market action. They do so because they naturally default to the physics model of external cause and effect and are therefore certain that some external action must be causing a market reaction. Their job, as they see it, is simply to identify which external cause is operating at the moment. When commentators cannot find a way to twist news causality to justify market action, the market’s move is often chalked up to “psychology,” which means that, despite the plethora of news and ways to interpret it, no external causality could even be postulated without exposing an overly transparent rationalization. Few proponents of the physics paradigm in finance seem to care that these glaring anomalies exist.
Read again carefully the newspaper excerpt quoted above. If you at some point begin laughing, you’re halfway to becoming a socionomist.
A Model That Cannot Predict Financial Events
Let’s ask another question of our believers in the cause-and-effect physics model of finance. What was the cause in August 1982 of the start of the strongest one-year rally in stocks since 1942-1943? (Was it the bad news of the recession? No, that doesn’t make sense.) What was the cause in early October 1987 of the biggest stock market crash since 1929? (Don’t spend too much time trying to figure this one out. An article from 1999, twelve years later, says, “Scholars still debate the reason why” the stock market crashed that year.8)
Can you imagine physicists endlessly debating the cause of an avalanche and feeling mystified that it happened? Physicists know why avalanches happen because they are using the right model for physics, i.e., physics, incorporating the laws and properties of matter and physical forces. The crash of 1987 mystifies economists because they are using the wrong model for finance, i.e., physics. They are sure that the crash was a reaction, so there must have been an external action to cause it. They can’t find one. Why? Because they are using the wrong model of financial causality.
No External Causality
The model is wrong because it assumes that each element of the social scene is as discrete as billiard balls. But they are not. Here is a pertinent passage from The Wave Principle of Human Social Behavior: When dealing with social events, what is an “external shock”? What is an “outside cause”? Other than the proverbial asteroid striking the earth, which presumably might disrupt the NYSE for a couple of days, or the massive earthquake or destructive hurricane that we repeatedly observe does not affect financial market behavior in any noticeable way, there is in fact, in the social context, no such thing as an outside force or cause. Every “external shock” ever referenced in finance is in fact an internal event. Trends in the stock market, interest rates, the trade balance, government spending, the money supply and economic performance are all ultimately products of collective human mentation. Human minds create these trends and change both them and their apparent interrelationships as well. It is men who change interest rates, trade goods, create earnings and all the rest. All social events, whether a rise in interest rates, a drop in the stock market, or even a war, are the result of collective human mentation. To suggest that such things are outside the social phenomenon under study is to presume that people do not communicate (consciously or otherwise) with each other from one aspect of their social lives to another. This is not only an unproven assumption but an absurd one. All financial events, indeed all social movements, are part and parcel of the interactive flux of human cooperation. All such forces are intimately commingled all the time. Yet to the conventional analyst, each is as detached a cause as a cue stick striking a billiard ball. It is this error that so profoundly undermines the conventional approach.9
The more useful model of social (including financial) causality is socionomics, the theory that aggregated unconscious impulses to herd conform to the Wave Principle, a patterned robust fractal. In this model, social actions are not causes but rather effects of endogenous, formologically determined changes in social mood. To learn more about this new model of finance, see the April and May issues of The Elliott Wave Theorist and the two-volume set, Socionomics.
Many people, by the way, dismiss the Wave Principle as impossible because they think that news and events move the market. We have shown that this notion is highly suspect. I hope that the demonstrations offered in this and the previous issue remove a primary impediment to a serious exploration of the Wave Principle model of financial markets.
A Stone’s Throw
This discussion about the natural tendency of people to apply physics to finance explains why successful traders are so rare and why they are so immensely rewarded for their skills. There is no such thing as a “born trader” because people are born — or learn very early — to respect the laws of physics. This respect is so strong that they apply these laws even in inappropriate situations. Most people who follow the market closely act as if the market is a physical force aimed at their heads. Buying during rallies and selling during declines is akin to ducking when a rock is hurtling toward you. Successful traders learn to do something that almost no one else can do. They sell near the emotional extreme of a rally and buy near the emotional extreme of a decline. The mental discipline that a successful trader shows in buying low and selling high is akin to that of a person who sees a rock thrown at his head and refuses to duck. He thinks, I’m betting that the rock will veer away at the last moment, of its own accord. In this endeavor, he must ignore the laws of physics to which his mind naturally defaults. In the physical world, this would be insane behavior; in finance, it makes him rich. Unfortunately, sometimes the rock does not veer. It hits the trader in the head. All he has to rely upon is percentages. He knows from long study that most of the time, the rock coming at him will veer away, but he also must take the consequences when it doesn’t. The emotional fortitude required to stand in the way of a hurtling stone when you might get hurt is immense, and few people possess it. It is, of course, a great paradox that people who can’t perform this feat get hurt over and over in financial markets and endure a serious stoning, sometimes to death. Many great truths about life are paradoxical, and so is this one.
NOTES:
3 Associated Press, “Possible rate increase sends stocks reeling,” The Atlanta Journal-Constitution, p. C5. May 21, 2004.
4 The real story here is that the market went down despite his upbeat comments, not because of anything he said.
5 Walker, Tom, “Stocks plunge on Greenspan’s rate-boost hint,” The Atlanta Journal-Constitution, April 21, 2004.
6 Walker, Tom, “Greenspan soft-pedals on rates; market rebounds,” The Atlanta Journal-Constitution, p. F4. April 22, 2004.
7 Shell, Adam, “Greenspan calms jittery investors,” USA Today, April 22, 2004.
8 Walker, Tom, “Identifying sell-off trigger difficult.” The Atlanta Journal-Constitution, p. F3. August 6, 1998.
9 See page 325 in The Wave Principle of Human Social Behavior.
|
At long last, the mainstream media is beginning to question buy-and-hold investing – it’s a myth that EWI’s original Independent Investor eBook debunked years ago. Even the “Efficient Market Hypothesis” has come under fire from the Oracle of Omaha himself – the Independent Investor long ago exposed EMH for the fantasy it is. Now that the mainstream has finally caught up to these myths, the Independent Investor eBook can once again put you ahead of the herd; you can understand truths today that the mainstream will catch up to someday in the future.
You’ll get the most groundbreaking and eye-opening reports ever published in Elliott Wave International’s 30-year history, PLUS 6 brand-new chapters (43 new pages) of specific analysis, forecasts and commentary that will help you think independently in today’s tumultuous market. Tens of thousands read the first Independent Investor, but even many of them will miss out on the important new advice the new, greatly expanded eBook imparts. Put yourself ahead of the herd for years to come – get a copy of the new 118-page Independent Investor eBook today.
Download the New Independent Investor eBook now. It’s FREE.
 |
Trading Stocks
There are many ways to use technical analysis to improve your odds in trading. Here are a few free lessons from Elliottwave International.
Here is a video of Robert Prechter at Bloomberg right after he covered his S&P500 short:

How to Use Bar Patterns to Spot Trade Setups
EWI’s Jeffrey Kennedy shows you what a simple price bar can tell you about a market -August 16, 2012
Senior Analyst Jeffrey Kennedy has spent over 15 years developing techniques to “read between the lines” on a price chart, and he shares some of his techniques with you in a FREE eBook: Learn to Identify High Confidence Trading Opportunities Using Price Bars and Chart Patterns.
You’d be amazed at how a simple price bar can provide you with so much information that can improve your trading success. In this excerpt from his eBook, Jeffrey explains how to interpret price bars and what that means for the subsequent market moves. Learn how you can download the entire 14-page eBook below.
Here’s a picture of two different price bars that we will consider to be daily price bars. What story does the single price bar on the left tell you?
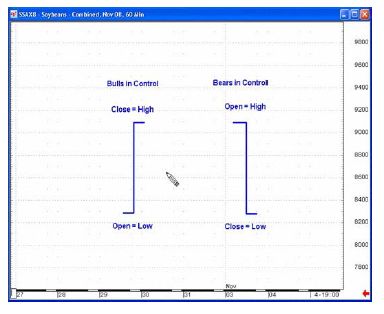 |
Prices opened that day at the lowest price and closed at the highest price, which means that the buyers, or bulls, are in total control of the market. The bears have no power whatsoever, and, because the market closed so high, odds are that the price will continue up the next day. As I said, one price bar can give you tons of information about a financial market.
Now, look at the price bar on the right. It tells you a similar story in the opposite direction. Once the market opened, it got slammed to the down side. It stayed down hard all day and closed on the lows. A market like this is dominated by the bears, the sellers, and odds favor further decline the following day. It means that the bulls, or the buyers, have no control in this market.
Although these kinds of price bars are fairly rare, they may open your eyes to how much information a single price bar can contain, especially if you know how to interpret it.
These two price bars are more like what you will encounter every day.
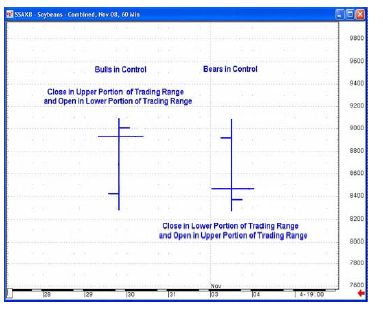 |
The price bar on the left side shows that the bears, or the sellers, opened the market up and pushed it down a little bit. In a sense, they had some control, but not much. Then the buyers, or the bulls, took control of this market so that it closed above the open. This type of price bar shows up in an uptrending market.
Conversely, the price bar on the right often shows up in downtrending markets. It signifies that the bears control the market. You could say that the buyers gave it a feeble attempt early on, but by the close, the sellers had taken over. Closes don’t lie, and they are the most important item on the price chart.
 |
Learn to Identify High Confidence Trading Opportunities Using Price Bars and Chart Patterns
When you look at a price chart, can you quickly spot the dominant trend? What about important reversals, or possible support/resistance levels? EWI has just released a free 14-page eBook: Learn to Identify High Confidence Trading Opportunities Using Price Bars and Chart Patterns. Senior Analyst Jeffrey Kennedy has spent over 15 years developing techniques to “read between the lines” on a price chart, and he shares some of his techniques with you in this new resource. You’ll be amazed at how a simple price chart can provide you so much information that can improve your trading success. |
If you are a trader or are the least bit interested in trading, you’re most likely “chart-centric.” A good chart is priceless if it helps to identify a great opportunity.
But without the right education, you could be missing high-probability trade setups that should be staring you right in the face.
That’s where Elliott Wave International’s free report, How to Use Bar Patterns to Spot Trade Setups, can help.
The five-page report includes 13 instructional charts with simple explanations of specific bar pattern formations. With thousands of downloads to date, it’s one of EWI’s most popular and useful trading resources.
Click Here to Access Your Free Report
How do you know when to close your short?
Here is Prechter talking about the current crash (2008-2009-2010-2011 and perhaps 2012 according to Kontradiev Cycle) and closing his initial short position:
Note that Prechter was bullish from early March to August 2009 and in August he recommended adding short positions. By December 2009, he was 200% short. You can subscribe to Prechter’s market forecasting service here:
 |