This “Lopsided” Stock Market Ratio Is Sending a Clear Signal.
Investors always find ways to “rationalize” bearish or bullish stances.
For a stock market investor who understands that markets are not random or chaotic but instead patterned, the most important information to know is the price pattern of the market in question.
For an Elliott wave investor, the task is even more defined. As Frost & Prechter’s Wall Street classic book, Elliott Wave Principle, says:
The market’s progression unfolds in waves. Waves are patterns of directional movement.
So, familiarity with the Elliott wave model for forecasting financial markets is a must.
Another key factor in analyzing the stock market is sentiment. The reason why is because when bullish or bearish sentiment reaches an extreme, financial history shows that a “tipping point” — in the opposite direction — is usually just around the corner.
With that in mind, let’s review a chart and commentary from the April 7 U.S. Short Term Update, an Elliott Wave International thrice weekly publication which provides near-term forecasts for major U.S. financial markets:
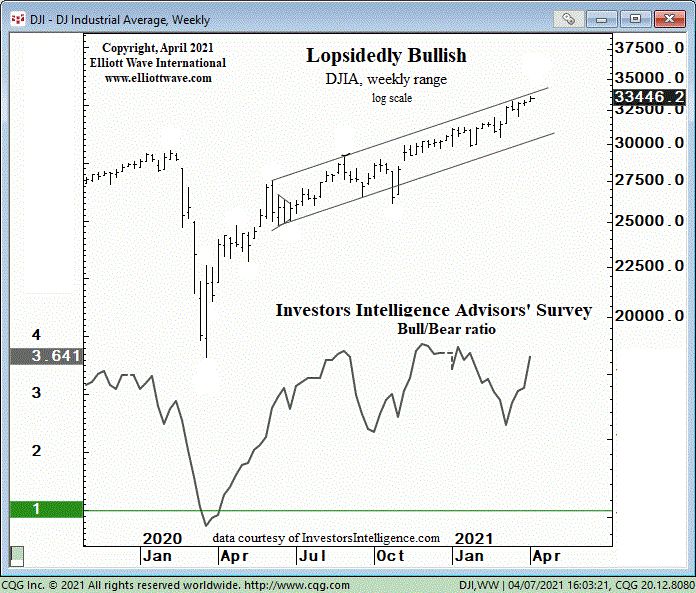
Investment advisors are lopsidedly bullish … as shown on this chart of the Investors Intelligence bull/bear ratio, which pushed to 3.64 last week. At the end of the previous [downward Elliott wave] the ratio was 0.72:1, with more bears than bulls. Investors herd. They become more bearish when the trend is declining and more bullish when the trend is rising. All “reasons” that are offered as to why they are becoming more bearish or bullish are just rationalizations. …
As an example, consider this March 31 Business Insider headline:
Stocks are expensive and retail inflows are soaring, but Goldman Sachs says history shows the market is not in a bubble
Hmm — if stocks are expensive and the public is investing like there’s no tomorrow, isn’t that the definition of a frothy market — i.e., a bullish extreme in the sentiment?
An April 6 Marketwatch article cited $5.3 trillion in COVID economic stimulus, an economic organization’s doubling of its projections for U.S. GDP growth and a strong March jobs report. It then followed by saying:
What this means is that the U.S. market is poised to outperform other major stock markets in the 2020s just as it did in the 2010s … .
The U.S. market might outperform major European or other stock markets around the globe for the remainder of the decade. Yet, the point is that “reasons” can always be found to support a particular stock market sentiment.
Yes, knowledge of sentiment extremes often serves as a red flag that a change of trend may be at hand.
Yet, as said, it’s also important to focus on the market’s wave pattern.
As Frost & Prechter’s book, Elliott Wave Principle: Key to Market Behavior, says:
The Wave Principle often indicates in advance the relative magnitude of the next period of market progress or regress. Living in harmony with those trends can make the difference between success and failure in financial affairs.
If you’d like to read the entire online version of the book, you can do so for free.
That’s right — all that’s required for free access to this Wall Street classic is a Club EWI membership. Club EWI is the world’s largest Elliott wave educational community with about 350,000 members and is free to join. When you join Club EWI, you are instantly granted free access to a treasure trove of Elliott wave resources on investing and trading.
Just follow this link to get started: Elliott Wave Principle: Key to Market Behavior — free and unlimited access.