What Are the BEST Technical Indicators for Stock Market Trading?
8 technical analysis tools that give any trader an edge – By Elliott Wave International
You may have seen a TV ad where “traders” describe their strategies, and one says, “I trade on fundamentals.” That sounds very reassuring — except that, on any given day, “fundamentals” are a mixed bag:
- You might have a good U.S. employment report…but bad news from Europe
- A positive Fed statement…but a negative housing number
- Strong earnings…but slowing consumer spending
And so on. Which “fundamental” factor trumps the other? Which one carries more weight in your forecast? Your guess is as good (or bad) as anybody’s. Evidence shows news does not move the stocks. Same can be told of earnings. Goog earnings appear at market tops, bad earnings appear at bottoms. Trading based on news and earnings is like driving looking at the rearview mirror.
Your alternative is technical analysis, which forecasts the markets’ short- and long-term moves based on objective metrics, not guesses.
Here at EWI, we’ve always strived to help our readers learn to think for themselves. So we’ve put together for you a free 8-lesson report, “Best Technical Indicators for Successful Trading” that teaches you how to use these technical indicators:
- The Personality of Elliott Waves
- Head and Shoulders Pattern
- Fibonacci Retracements
- Advance-Decline Line
- Sentiment
- Volume
- Trendlines
- Momentum Analysis Using MACD
Here’s a small preview of this free 8-lesson report.
Trendlines
A trendline represents the psychology of the market; specifically, the psychology between the bulls and the bears. If the trendline slopes upward, the bulls are in control. If the trendline slopes downward, the bears are in control.
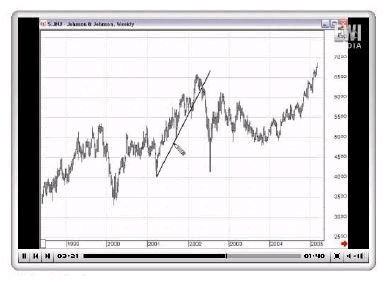
Moreover, the actual angle or slope of a trendline can determine whether or not the market is extremely optimistic, as it was in the upwards sloping line in Figure 1-1 or extremely pessimistic, as it was in the downwards sloping line in the same figure.
Now we’re on to the fun part: drawing trendlines. You can do this several different ways…
 Finish Reading This 8-Lesson Report Today, FREE Finish Reading This 8-Lesson Report Today, FREE
In this free report, you will learn some of the most effective tools of the trade from analysts at Elliott Wave International, the world’s largest technical analysis firm. Find out which technical indicators are best for analyzing chart patterns, which are best for anticipating price action, even which are best for spotting high-confidence trade setups — plus how they all complement Elliott wave analysis. |