How “Hot” Stock Market Ideas Can Burn Investors
The Meme Stock Index sees a 36% decline since January.
On July 30, this headline appeared on a well-known investment website:
It’s Definitely Possible to Make a Fortune Off Meme Stocks
And, it’s definitely true that many investors, especially newbies, have tried.
As you probably know, “meme” stocks may be loosely defined as stocks that become a white-hot focus of interest due to social media hype. The price of these shares can skyrocket within a short period of time. However, as you might imagine, these highly speculative issues can just as quickly turn southward.
Indeed, take a look at this chart from the recently published August Elliott Wave Financial Forecast, a publication which provides Elliott wave analysis of major U.S. financial markets. The accompanying commentary is below the chart:
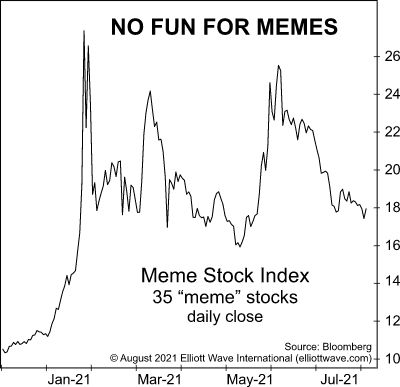
Legions of new investors continue to chase the latest hot ideas. … Meme stocks are [a] mutant strain reflecting bullish enthusiasm despite price weakness. This chart shows a steady decline in an index of 35 meme stocks. Despite a decline of 36% since January, many headlines in July insist that the “Meme Stock Revolution” lives on.
This is from an August 10 CNBC article:
Short seller Jim Chanos said retail investors are not considering all the downside involved with speculative trading in so-called meme stocks.
Yet, let’s pivot from here and state that all stock market trading is speculative, even with the so-called “blue chips.” In other words, the main stock market indexes can significantly decline just like the meme stock index.
So, while “traditional” investors may largely steer clear of meme stocks, many of them may be unprepared for a possible trend turn in the Dow Industrials and the S&P 500 index.
Why will the majority likely be unprepared? Well, consider this quote from a July 18 Wall Street Journal article:
Throughout 2021, a range of surveys, fund-flow figures and options activity have shown investors big and small to be exceptionally bullish.
The best way to avoid getting caught flatfooted when an inevitable trend change occurs is to see what the Elliott wave model is revealing about the broad market’s price pattern.
If you’re unfamiliar with the Wave Principle, or need to brush up on your knowledge, you can read the online version of Frost & Prechter’s Elliott Wave Principle: Key to Market Behavior — 100% free!
Here’s a quote from the first page of Chapter 1 of this Wall Street classic:
In the 1930s, Ralph Nelson Elliott discovered that stock market prices trend and reverse in recognizable patterns. The patterns he discerned are repetitive in form but not necessarily in time or amplitude. Elliott isolated five such patterns, or “waves,” that recur in market price data. He named, defined and illustrated these patterns and their variations. He then described how they link together to form larger versions of themselves, how they in turn link to form the same patterns of the next larger size, and so on, producing a structured progression. He called this phenomenon The Wave Principle.
All that’s required for free access to the book is a Club EWI membership. Club EWI is the world’s largest Elliott wave educational community and is free to join. Members enjoy complimentary access to a wealth of Elliott wave resources on financial markets, investing and trading. You are under no obligations as a Club EWI member.
Just follow this link to get started: Elliott Wave Principle: Key to Market Behavior — free, unlimited and instant access.