As mainstream experts struggled to see the direction in gold, Elliott wave analysis saw a clear, bullish triangle. Then, gold prices rocketed to six-year highs!
A common misconception of trading is that the best opportunities come near market highs and lows, when a change-in-trend is on the launchpad with 10 seconds to liftoff.
The problem is, these rapid-fire moves are incredibly formidable. Anticipating them correctly comes with high degrees of difficulty and failure.
The truth is, the most confident market opportunities take longer to develop. Rather than shoot up or crash down, the price trend during these intervals is sideways, slow and rangebound.
Many traditional styles of market analysis are unable to navigate these “holding” periods. No one fundamental event stands out as either bullish or bearish, ultimately leading to a lack of clarity for the market’s future.
One of the benefits of the technical market discipline known as Elliott wave analysis is its ability to recognize this seemingly directionless price action for what it really is: the triangle pattern. These long, drawn out corrective structures are well-known to analysts and traders, because they give meaning to the time before the resumption of the next strong move.
The “Bible” on all things Elliott is Frost and Prechter’s classic Elliott Wave Principle — Key to Market Behavior. The book’s first chapter offers an extensive overview:
“Triangles appear to reflect a balance of forces, causing a sideways movement that is usually associated with decreasing volume and volatility. Many analysts are fooled into labeling a completed triangle way too early.”
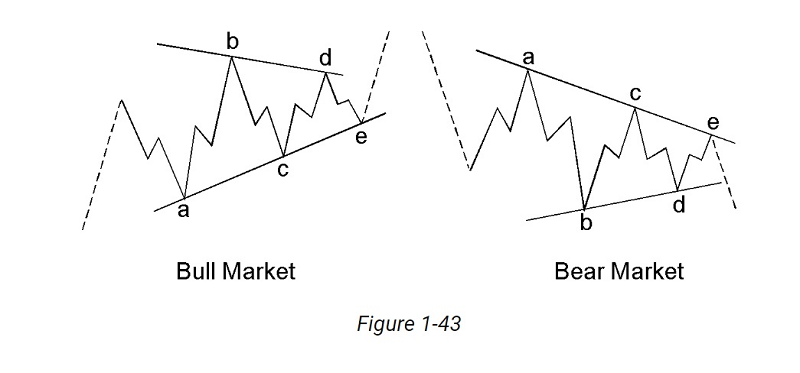
Triangles always unfold in a position prior to the final actionary wave in the pattern of one larger degree, i.e. wave 4 in an impulse, or wave B in an A-B-C. But what this pattern requires in patience, it rewards with promise. Explains EWP:
“Elliott used the word ‘thrust’ in referring to this swift, short motive wave following a triangle.”
We at Elliott Wave International can proudly point to the gold market for a real-world example of the mainstream confusion versus Elliott wave clarity that accompanies the triangle pattern — and the powerful thrust that follows.
The scene begins in early May 2019 amidst a multi-year long, sideways movement in gold — pictured below:
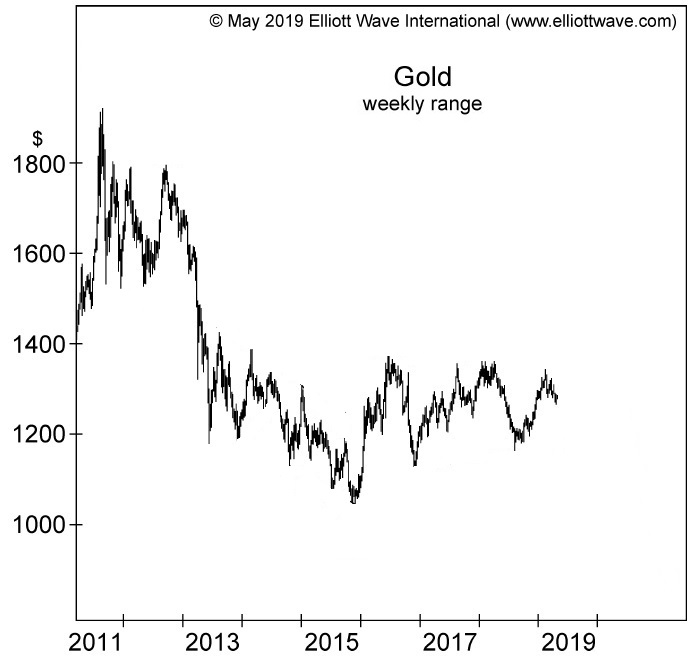
Mainstream analysts were at their wit’s end about gold’s future. Wrote one May 16 CNBC: “Gold Struggles for Direction as Dollar Firms, Equities Drop”
Added another: “Wall Street, Main Street in a Quandary Over Direction of Gold Prices” – May 3 Kitco.
This piece vividly captured the lack of consistency and clarity among the fundamental experts, writing:
“Talk about indecision. Talk about this week’s Kitco News gold survey.
“Sean Lusk, director of commercial hedging with Walsh Trading, figures gold will benefit from the Federal Reserve’s reluctance to hike interest rates despite robust economic data. ‘I think the path of least resistance is higher here,’ he said.
“Meanwhile, Colin Cieszynski, chief market strategist at SIA Wealth Management, looks for prices to retreat. ‘Gold remains in a downtrend and the U.S. dollar continues to climb,’ he said.”
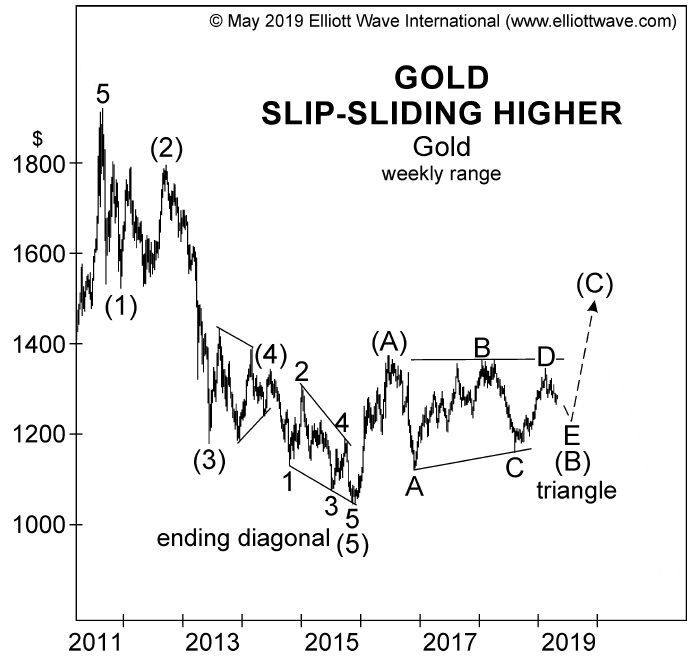
But as Elliott Wave Principle — Key to Market Behavior observes, this sideways movement is usually associated with the triangle pattern. And, in our May 2019 Elliott Wave Financial Forecast segment on gold, EWI’s chief analysts Steve Hochberg and Peter Kendall confirmed a bullish triangle was underway in gold — one that would lead to the pattern’s iconic “thrust.” Here’s an excerpt from the May 2019 EWFF:
“Over the past several weeks, we have read myriad explanations as to why gold prices should rally or decline, from improving euro-area GDP numbers (bearish) to Persian Gulf tensions (bullish) to U.S. dollar strength (bearish) to Fed rate hikes on hold (bullish)…
“A mixed bag of opinions is perfectly compatible with gold’s sideways movement in the triangle pattern…
“When the decline is complete, this wave will conclude Intermediate wave (B). Intermediate wave (C) will then be a five-wave advance that carries to $1400-$1550.“
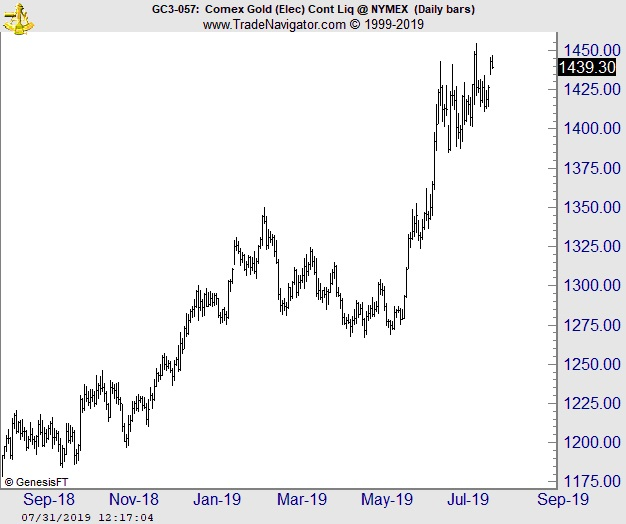
By the end of May, the triangle had ended and gold’s dramatic “summer of love” proceeded to take prices to their highest level in six years! The full extent of gold’s post-triangle rally can be seen on the chart below:
Most of the time, 70%-80% in fact, a market’s price action develops as one of the five core Elliott wave patterns. For the first time since its 1978 release, we’re giving away the sacred text, Elliott Wave Principle — Key to Market Behavior, so traders can transform “quandary” into “clarity” on the world’s leading financial markets.