Margin: How Stock Market Investors Are “Reaching for the Stars”
This is the highest ratio in the 20-year history of the data.
One of the historic ways that stock market investors exhibit conviction about the direction of prices is to use leverage or participate in the market with borrowed money. Yet another way of putting it is to “trade on margin.”
Going all the way back to 1929, that was the downfall of many who viewed the market as a quick way to get rich.
Here’s an Oct. 29, 1929 Boston Daily Globe headline:
Margin Account Dumping Brings Stock Crash …
Yet, you can find examples in more recent history too
Here’s a chart and commentary from the June 2007 Elliott Wave Financial Forecast, a monthly publication which offers analysis of major U.S financial markets:
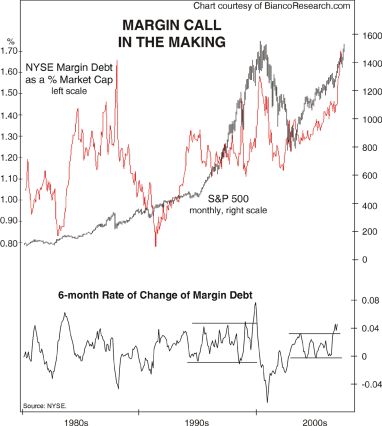
Another area where investors are expressing a wild-eyed optimism rivaling that of 2000 is in their use of leverage. The chart shows that April brought another surge in the use of NYSE margin (shown as a percentage of market capitalization). A similar push accompanied the S&P 500’s big top in 2000. The six-month rate of change at the bottom of the chart depicts a rare 4% surge in the use of margin.
As you probably know, the stock market hit a top four months later.
This brings us to what’s going on in the latter weeks of 2020. The November Elliott Wave Financial Forecast shows a chart titled “Reaching for the Stars with Borrowed Money” and says:
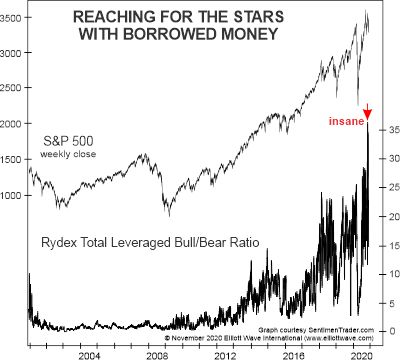
In recent weeks, some investors have upped the ante by jumping in further with borrowed money. On October 14, the Rydex Total leveraged Bull/Bear Ratio hit 36, which means Rydex mutual fund investors had 36 times as much money invested in leveraged bullish funds vs. leveraged bearish funds. This is the highest ratio in the 20-year history of the data. …
The extreme use of margin does not mean the market will top this week or next. Yet, history shows that it does serve as a reliable signal for what may be ahead.
It’s best to also look at the stock market’s Elliott wave pattern, which can provide an investor with a more precise assessment of a market turn juncture.
You see, the Wave Principle provides guidelines for forecasting.
As the book, Elliott Wave Principle: Key to Market Behavior, says:
Many of these guidelines are specific and can occasionally yield stunningly precise results. If indeed markets are patterned, and if those patterns have a recognizable geometry, then regardless of the variations allowed, certain price and time relationships are likely to recur. In fact, experience shows that they do.
Would you like to get more insights into the Elliott wave method for forecasting financial markets?
You can — and 100% free at that!
You can have the online version of the Wall Street classic book by Frost & Prechter on your computer screen in moments by following this link: Elliott Wave Principle: Key to Market Behavior — free access.