Stochastic oscillator
The stochastic oscillator is a technical analysis oscillator (or two oscillators) showing the latest closing price in relation to the trading range of the past N days. This concept is unrelated to a stochastic in mathematics or statistics.
These stochastics were described by George Lane in the 1950s. It’s unclear whether the idea was original to him, he may have learnt of it from a previous employer Ralph Dysant, and indeed he in turn from earlier traders.
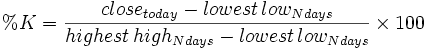
Two oscillator lines are calculated, called %K and %D, each ranging from 0 to 100. %K is the closing price within the past N-days trading range, ranging from 0 when the latest close is a new N-day low, up to 100 for a new N-day high,
%D is a 3-day simple moving average of %K,
The usual “N” is 14 days, ie. a fortnight’s worth of past data, but this can be varied. Levels near the extremes 100 and 0, for either %K or %D, indicate strength or weakness (respectively) with prices making or approaching new N-day highs or lows.
Levels above 80 and below 20 can be interpreted as overbought or oversold, but not on their own, only with other factors. Lane recommended waiting for a return back through those thresholds, ie. when the oscillator goes above 80, wait for it to fall below 80 before selling; or vice versa on going below 20 wait for a rise back above 20 before buying; which in effect means waiting for a bit of a reversal. Or alternately levels 80 and 20 might be traded when some other technical indicator suggests a non-trending market.
%D acts as a trigger or signal line for %K. A buy signal is given when %K crosses up through %D, or a sell signal when it crosses down through %D. Such crossovers can occur too often, and to avoid repeated whipsaws one can wait for crossovers occurring together with an overbought/oversold pullback, or only after a peak or trough in the %D line.
Some traders consider the basic %K and %D too volatile, giving too many signals and too many whipsaws. This is addressed by forming “slow” stochastics. %K values are first smoothed by a 3-day simple moving average, and then the %D formed by a further 3-day SMA on that. This “slowed” %K is the same as the “fast” %D, but it’s easiest just to think of the slow form as first inserting an extra smoothing.
%K is the same as Williams %R, though on a scale 0 to 100 instead of -100 to 0, but the terminology for the two are kept separate.