EXTREME SENTIMENT SIGNALS TREND CHANGE
In March 2009, stock prices were at a 12-year low, and the Dow Industrials were down 54% from the 2007 peak.
You’d have needed to search far and wide to find someone calling for a rebound. Most investors feared that more of the same was ahead for stocks.
But on the very day the Dow hit the 6,547 price low (March 9, 2009), a Wall Street Journal headline read:
Dow 5000? There’s a Case for It
At the time, a closely watched sentiment index had also reached an all-time low at 2% bulls.
Even so: Just days before stocks bottomed, Bob Prechter said this to subscribers:
I recommend covering our short position at today’s close. … Probabilities for further decline immediately ahead have shifted. … The market is compressed, and when it finds a bottom and rallies, it will be sharp and scary for anyone who is short.
The Elliott Wave Theorist, February 2009
Indeed, the market did rally. Granted, the duration of the uptrend has lasted longer than anticipated. Yet that has led to extreme investor complacency. Look at this chart from the Jan. 23 Financial Forecast Short Term Update (labels removed):
As you probably know, the CBOE Volatility Index, or VIX, is a measure of investor fear (or the lack thereof). You can see on the chart how fearful investors were at the end of 2008 and leading up to the March 2009 low. That’s a stark contrast to the lack of fear you see above. Investors are as comfortable with stocks as they were around the Dow’s 2007 all-time high.
A recent headline, quoting the head of JPMorgan Chase, is indicative of the broadly optimistic sentiment.
US Stocks At ‘Very Good Prices’ -CNBC, Jan. 24
Is this the time to tap into the current uptrend, or should you separate yourself from the crowd in anticipation of a turn? Well, the Jan. 23 Short Term Update referenced the strong emotions that attend the end of long market trends and then noted:
It’s difficult to lean against the crowd and doing so doesn’t automatically mean that you’ll be right. There are never guarantees. But the odds are in your favor.
Please know that EWI does not recommend defying the crowd for its own sake. To be sure, a contrarian can get trampled during the strongest parts of bull markets, or mauled during the worst part of bear markets.
A prudent investor looks at the best available evidence before deciding how, when and if to act.
Be assured, dear reader: Your risk-free review will likely be one of the most important investments you make at this juncture.
To that end, EWI offers you a no-obligation education in Elliott Wave analysis. See below for details.
 |
Learn the Why, What and How of Elliott Wave Analysis
The Elliott Wave Crash Course is a series of three FREE videos that demolishes the widely held notion that news drives the markets. Each video will provide a basis for using Elliott wave analysis in your own trading and investing decisions. |
How to Spot a Stock Market Top
Back in March 2007, Robert Prechter recommended to short stocks. Fast forward to March 2009, he recommended to cover the short for a 800 point gain on S&P 500 and he predicted a rally that would take S&P 500 to 1100. As the rally matured, he started to get bearish again. But in April, he explained how all technical indicators were lined up on the sell side. Exact opposite of March 2009. Here is how the bullish media ridiculed him:
April 8, 2010: Prechter on Fast Money Show
Bulls don’t let Prechter speak! And that’s a sell signal!
Prechter Called the Uptrend ‘Out’ in April – June 9, 2010
By Elliott Wave International
Even non-sports fans have heard by now about the recent debacle known as Baseballgate.
With two outs in the ninth inning, a first-base umpire called “SAFE” when the runner was clearly “OUT.” But this was no ordinary missed call; it cost Detroit Tigers pitcher Armando Galarraga a perfect game.
And as the blogosphere flooded with memories of other historic slip-ups that cost “so and so” star “this and that” honor. Demands for the commissioner of baseball to reverse the bad call grew louder by the hour.
It was indeed a very bad call. But the biggest, baddest call of all was not made on a sports field. It was made in the field of finance — specifically on the stock market. To wit: The mainstream umpires of finance stood near first base, and in April made this emphatic call for the uptrend in stocks:
“SAFE!!”
Call Your Own Shots — Remove Dangerous Mainstream Assumptions from Your Investment Process. Elliott Wave International’s FREE, 118-page Independent Investor eBook shows you exactly what moves markets and what doesn’t. You might be surprised to discover it’s not the Fed or “surprise” news events. Click here to learn more and download your free, 118-page ebook.
In case you missed the event, here’s an instant replay:
- “Stocks Remain In A Powerful Bull Market.” (April 10 Bloomberg)
- “Stocks Haven’t Lost Their Appeal As The Market Goes Up, Up, And Away.” (April 21 US News & World Report)
- “You can use any number of words to describe this bull market. Frothy is not one of them. This market is reasonably priced.” (April 21 AP)
- “US Stocks Post Longest Winning Streak Since 2004. The recovery should be sustainable and that will drive the market.” (April 24 Bloomberg)
- “All the economic reports are pointing up… despite lingering worries over debt problems in Greece. Right now, there is virtually no evidence of a top.” (April 30 USA Today)
Yet from its April 26 peak, the DJIA turned down in a jaw-dropping 1000-plus point selloff. The market suffered its worst May since 1940.
The markets have no commissioner to reverse the bad call of the financial mainstream. But at least one team of analysts remained ahead of the most game-changing moves in the world’s leading stock market, including a forecast that called the rally “OUT” in April 2010. Consider the following insight from EWI President Robert Prechter:
On April 16, Prechter published his April Elliott Wave Theorist titled “Deadly Bearish Picture.” Notice the dates.
“We can project a top…between April 15 and May 7, 2010. It is rare to have technical indicators all lined up on one side of the ledger. They were lined up this way — on the bullish side — in late February-early March of 2009. Today, they are just as aligned, but on the bearish side.”
TradingStocks.net published Prechter’s Deadly Bearish call for Stock Market Crash on April 29.
April 26 marks the high for the DJIA, followed by the devastating drop on May 7 — exactly within the date range Prechter’s forecast called for.
Call Your Own Shots — Remove Dangerous Mainstream Assumptions from Your Investment Process. Elliott Wave International’s FREE, 118-page Independent Investor eBook shows you exactly what moves markets and what doesn’t. You might be surprised to discover it’s not the Fed or “surprise” news events. Click here to learn more and download your free, 118-page ebook.
A record of spotting major market turns most investors miss
Elliott Wave International is dedicated to helping subscribers anticipate the next major market turn. No, we don’t always “get it right” – yet the examples below speak for themselves.
1. In 2005, EWI called the 2006 real estate turn.
- Some say real estate can’t go down because far too many people are concerned about a real estate bubble, a worry that is now even greater than it was for stocks at the March 2000 NASDAQ peak … it is actually another sign of a top when participants are dismissive of the warnings.
The Elliott Wave Financial Forecast, July 2005
- House prices peaked in July 2006. By April 2012, the Associated Press reported, “Home prices have fallen 35% since the housing bust.”
2. In 2007, EWI called the stock market turn.
- Aggressive speculators should return to a fully leveraged short position now. We may be early by a couple of weeks, but the market has traced out the minimum expected rise, and that’s enough to act upon.
The Elliott Wave Theorist, Interim Report, July 17, 2007
- Those aggressive speculators were rewarded. From an Oct. 9, 2007, high of 14,164, the Dow Industrials tumbled to 6,547 by March 9, 2009.
3. In 2008, EWI called the crude oil turn.
Less than six weeks before the $147 high in the price of oil, the June 2008 Financial Forecast observed that “The case for an end in oil’s rise is growing even stronger.” The chart below was published in that issue:
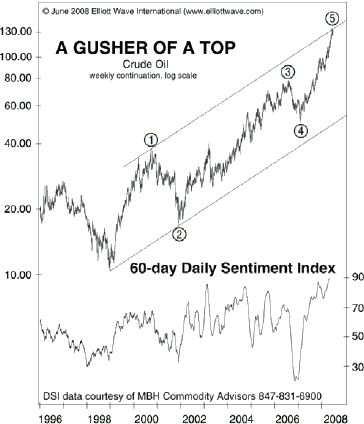
Note that the sentiment index on the chart shows bullish sentiment reaching 90%.
By December 2008, the price of oil had declined 80%.
4. In 2011, EWI called the retracement high in the CRB Index.
- The CRB index has reached the upper end of its corrective-wave trend channel while simultaneously reaching a Fibonacci 50% (1/2) retracement of the 2008-2009 decline, as it completes an A-B-C rally. This index should soon begin another wave down that takes it below the 2009 low.
The Elliott Wave Theorist, January 2011
- The CRB index topped less than four months later.
5. In 2012, EWI called the turn in gas prices.
- The rush to extrapolate [rising prices] is all we need to conclude that the odds of … gasoline prices going to the moon are extremely low.
The Elliott Wave Theorist, April 2012
- Gasoline prices topped during the same month that issue published.
6. In 2009, EWI called the turn in stocks.
- The majority of investors thought that the period from October 10 to year-end 2008 was a major market bottom. But over the past four monthsThe Elliott Wave Theorist, The Elliott Wave Financial Forecast and the Short Term Update have repeatedly stated, without equivocation, that the market required a fifth wave down. There were no alternate counts. The Wave Principle virtually guaranteed lower lows, and now we have them.
- I recommend covering our short position at today’s close.
The Elliott Wave Theorist, Special Investment Issue, Feb. 23, 2009
- The Dow Industrials hit a major low just 10 days later!
7. In 2012, EWI called the trend change in bond yields.
- Investors’ waxing fears will cause them to start selling bonds, which will lead to lower bond prices and higher yields. ….
- If rates do begin to rise as we expect, most observers will probably be fooled.
The Elliott Wave Theorist and Financial Forecast, Special Report, June 2012
- On July 5, 10-year bond yields climbed to 2.72%, its highest level since July 2011.
In each of these forecasts, the consensus opinion was on the opposite side. Most investors never saw these major trend changes coming. Again, we’re not perfect — no forecasting service is.
Come see what we see.
 |
Learn to Think Independently
You’ll get some of the most groundbreaking and eye-opening reports ever published in Elliott Wave International’s 30-year history; you’ll also get new analysis, forecasts and commentary to help you think independently in today’s tumultuous market. Download Your Free 50-Page Independent Investor eBook Now >> |
Stock Market Bottom Call – February 2009
Stock Market Top Call – October 2007
Become a member at Elliottwave International to get access to upto date financial forecasts: