Bollinger bands
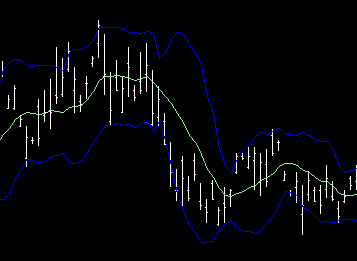 An example of Bollinger bands with a 10 day period and width of two standard deviations An example of Bollinger bands with a 10 day period and width of two standard deviations |
Bollinger Bands is a technical analysis tool invented by John Bollinger in the 1980s. They evolved from the concept of trading bands, and can be used to measure the relative highness or lowness of price.
Bollinger Bands consist of:
- a middle band being a N-period simple moving average
- an upper band at K times a N-period standard deviation above the middle band
- a lower band at K times a N-period standard deviation below the middle band
- Typical values for N and K are 20 and 2, respectively.
Predictive value
The bands cannot, as some have supposed, be used to make reliable statements regarding what fraction of an equity’s prices will lie within a certain distance of the mean value. This is because an individual equity’s price does not obey known distribution functions. For example, if the bands for plus or minus two standard deviations are computed, it is wrong to suppose that ~95% of an equity’s closing prices will, on average, lie within the bollinger bands. That would require, among other things, that the prices be normally distributed, which they are generally not. It would further require that the true standard deviation be known. The standard deviation calculated as above, however, is only an uncertain estimate of the true standard deviation. Furthermore, it should be realized that the “standard deviations” of stock prices for finite time periods are not fixed parameters as required to apply classical statistical theory, but instead are variables in constant flux depending on price volatility. Nevertheless, the bands have proved useful in technical analysis of stock prices. The bands give a reliable visual picture of a stock’s price volatility. No particular significance, however, should be attached to a price touching the upper or lower band, as Bollinger himself has pointed out. These occurrences should be considered in relation to other factors before making investment decisions.
It is of interest to note that faulty interpretation of a price touching or breaching a band based on incorrect statistical assumptions has become so widespread that some traders now use these events alone as trading signals and by so doing may have unwittingly injected significance into these band-touching events that would otherwise be absent.
When the bands lie close together a period of low volatility in stock price is indicated. When they are far apart a period of high volatility in price is indicated. When the bands have only a slight slope and lie approximately parallel for an extended time the price of a stock will be found to oscillate up and down between the bands as though in a channel. When this behavior is found to regularly repeat in conjunction with a fairly steady broad market, a traders may, with some validity, use a touch or near touch of the upper or lower band as an indication that a stock’s price is nearing the limit of its trading range and therefore a price reversal is probable.
Copyright (c) 2006 TradingStocks.NET Permission is granted to copy, distribute and/or modify this document under the terms of the GNU Free Documentation License, Version 1.2 or any later version published by the Free Software Foundation; with no Invariant Sections, no Front-Cover Texts, and no Back-Cover Texts. A copy of the license is included in the section entitled “GNU Free Documentation License”.