Just when you thought there’d been every possible adaptation of the Marvel comics movie franchise, we’ve thought of one more: A Marvel installment based on financial market analysis.
At one end of this Marvel market universe is Technipede: Like the insect he’s named for, Technipede uses hundreds of technical disciplines to stand on for evaluating a market’s strength or weakness. Bollinger bands, candlesticks, pivot points, TRIX, harmonics, advance/decline, and on — a different technical “leg” for each market and each time frame.
On the other end is bulging muscled Fundamentalist: Hero of the mainstream, Fundamentalist mines the news for every story that may affect future price action — supply/demand data, earnings, scandals, profits, political disruptions, weather patterns, and so on.
But neither one of these figures is any match for the most powerful character in this Marvel market universe — Jeffrey Kennedy, editor of our Trader’s Classroom and Commodity Junctures Service. Jeffrey’s strength comes from 25-plus years of mastering the Wave Principle and its ability to identify high-confidence trade setups in any market, across any time frame.
Every trading day, Jeffrey delivers the benefits of Elliott analysis to subscribers, via price charts in a wide variety of real-world markets. Take, for example, the retail king Amazon Inc. In the fall of 2018, Amazon was falling hard amidst a broader “meltdown” in FAANG stocks. Wrote one October 29 Bloomberg:
“How long can they go? That’s the key question for traders looking at some of Wall Street’s largest technology and internet stocks. People keep calling bottoms and getting hurt; they’re trying to catch falling knives.”
But in his October 30 Trader’s Classroom video lesson, Jeffrey showcased one of the five principle benefits of Elliott wave analysis; namely, its ability to determine the maturity of a trend. There, Jeffrey identified Amazon’s 2018 selloff as a fourth -wave correction.
Using the Elliott guideline of the depth of corrective waves, Jeffrey pinpointed a probable end to Amazon’s selloff “at or near the prior fourth wave extreme,” namely the lows seen in February and March of 2018. That meant Amazon had “another $100 or $200 bucks to the downside” before bottoming. (Jeffrey’s chart reprinted below)
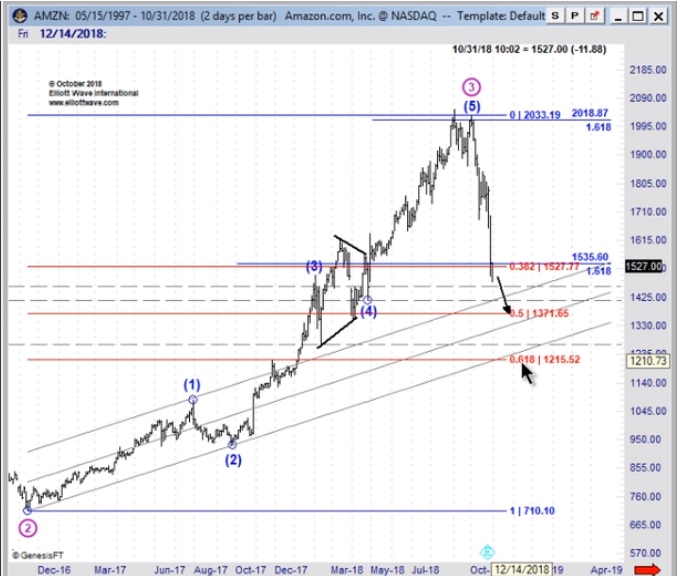
From there, Amazon continued its selloff into late December before settling 177 bucks lower, just as Jeffrey anticipated, a beautiful opportunity for traders.
What about a smaller time frame? Here, we go to the August 15 Trader’s Classroom where Jeffrey used one of the three cardinal Elliott wave rules to manage near-term risk in Dollar General (DG). He identified a wave 4 pullback, which, if correct, meant prices could not enter the price territory of wave 1 — 126.55. This established a clear, make-or-break level to place a protective stop. (Jeffrey’s chart reprinted below)
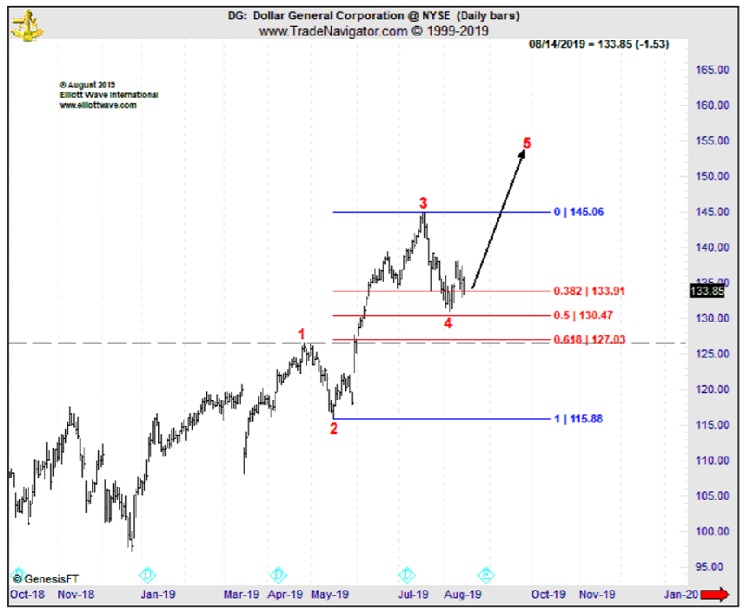
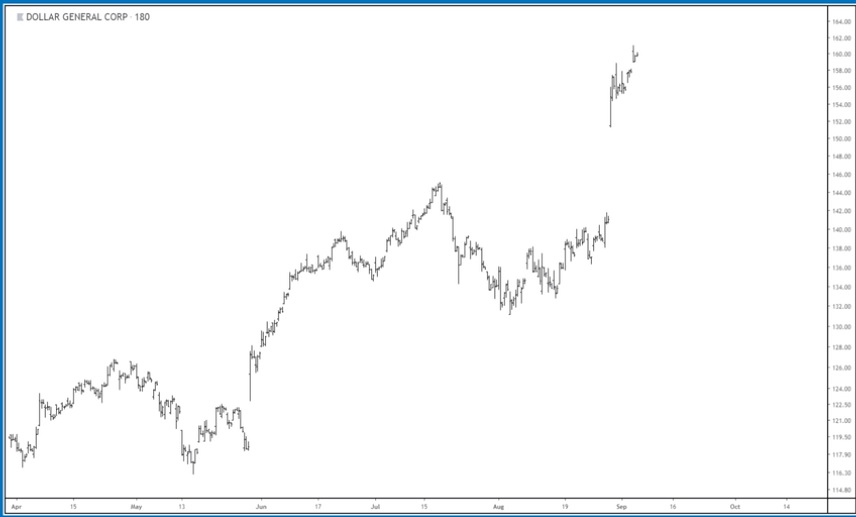
If prices stayed above that level, then DG would present a strong “buying opportunity” in a fifth wave rally to the “150-155 area.” And that’s exactly what happened via a powerful gap up and weeks long rally into Jeffrey’s upside target window.
What about an even smaller time frame for one of the most volatile commodity markets — crude oil? In the Sept 13 Daily Commodity Junctures, Jeffrey showed a core Elliott wave pattern on crude’s price chart — a contracting triangle. This pattern lingers sideways for a frustratingly long time, only to resolve in a powerful thrust. Armed with this knowledge, Jeffrey set the stage higher and said, “I won’t be surprised to see it pop up into the 60’s.” (Jeffrey’s chart reprinted below)
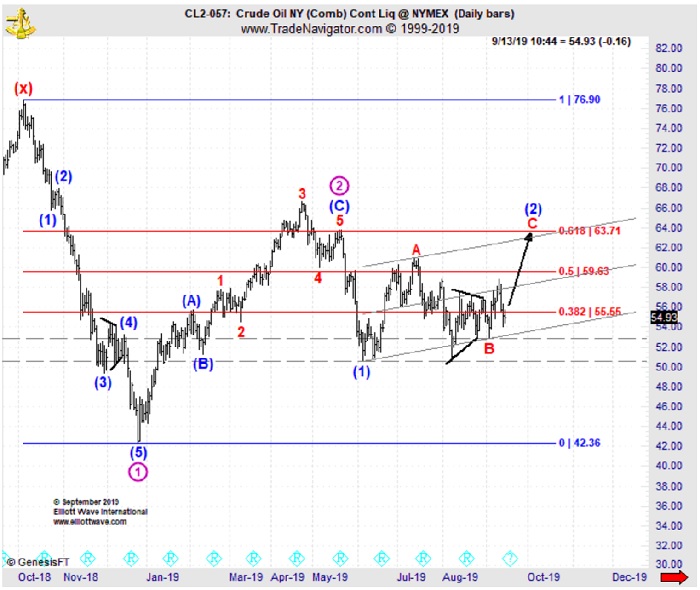
The next trading day, crude gapped up in its largest single-day rally since the 1991 Gulf War.
Okay, there’s obviously no such thing as a Marvel market universe. Elliott wave analysis is not akin to Iron Man’s shield of invincibility. But as these examples from Jeffrey Kennedy show, having Elliott in your trading arsenal makes it very possible to identify high-confidence opportunities in actual markets.
Which is why we’ve decided to bring you one of our most popular resources of Elliott education — “Discover 5 Reliable Setups in Just 26 Minutes,” taught by — you guessed it — Jeffrey Kennedy.
In this 26-minute long lesson, Jeffrey shows you how to quickly spot 5 price patterns. When you see one of these setups, you’ll know that prices are very likely to break hard, and soon.
The best part is, this 26-minute lesson is FREE to Club EWI members! You may not walk away a superhero; but you will have a supreme understanding of all things Elliott and its ability to identify trade setups in any market, on any time frame.