Stocks: How Sentiment Measures Offer Clues About What’s Likely Next
Insights into the stock market as a fractal
Elliott Wave International’s analysts track dozens of indicators, and our U.S. Short Term Update pays particular attention to those which may offer clues about the near-term.
Consider this analysis from the Sept. 26 U.S. Short Term Update, a thrice weekly Elliott Wave International publication which provides analysis of near-term trends of major U.S. financial markets:
Short term measures of investor sentiment indicate excess pessimism. … Stocks should start a countertrend rally to relieve the downside compression.
No analytical method can guarantee an exact day and time a forecast will be fulfilled — if it’s fulfilled at all. However, some 13 trading days later, the Dow did hit a low. By Nov. 30, the senior index was more than 5,000 points higher. Excess pessimism had morphed into excess optimism. Fear had morphed into complacency.
Indeed, the November Elliott Wave Theorist, a monthly publication which provides analysis of financial markets and major cultural trends, noted:
By several measures, optimism at the current time is equal to or greater than that which held sway at the broad market’s all-time high in November 2021 and at the blue chips’ all-time high in January 2022!
The stock market pendulum usually starts to swing the other way when an extreme is reached — in this case, extreme optimism. So, it hasn’t been surprising that prices have mainly trended lower since around the beginning of December — at least, so far.
So, are investors forever locked in to short-term swings between optimism and pessimism?
We all know the answer is “no” from looking at historic stock market charts. We see that short-term trends are part of intermediate term tends, which, in turn, are part of even larger trends and so on. In other words, the stock market is a fractal.
Here’s an illustration and commentary from Robert Prechter’s book, Last Call:
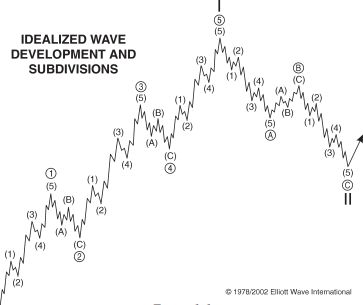
In 1938, Ralph Nelson Elliott … described the fluctuation of stock market prices as a fractal. He illustrated a patterned fractal in which movements in aggregate stock prices trace out five waves (of a certain description) in the direction of the one larger trend and three waves (or combinations thereof) in the countertrend direction.
[The illustration] is a stylized depiction of a full cycle of Elliott waves, with their traditional labels.
Key things for an investor to know is whether the “larger trend” is up or down, and the current juncture of the market in that larger trend.
You can get more insights into Elliott waves by reading Frost & Prechter’s Wall Street classic, Elliott Wave Principle: Key to Market Behavior. Here’s a quote from the book:
After you have acquired an Elliott “touch,” it will be forever with you, just as a child who learns to ride a bicycle never forgets. Thereafter, catching a turn becomes a fairly common experience and not really too difficult. Furthermore, by giving you a feeling of confidence as to where you are in the progress of the market, a knowledge of Elliott can prepare you psychologically for the fluctuating nature of price movement and free you from sharing the widely practiced analytical error of forever projecting today’s trends linearly into the future. Most important, the Wave Principle often indicates in advance the relative magnitude of the next period of market progress or regress. Living in harmony with those trends can make the difference between success and failure in financial affairs.
Good news: You can access the entire online version of the book for free once you become a member of Club EWI, the world’s largest Elliott wave educational community.
A Club EWI membership is also free and allows for complimentary access to a wealth of Elliott wave resources on investing and trading.
A wonderful world of Elliott wave education awaits you! Join Club EWI now by following this link: Elliott Wave Principle: Key to Market Behavior — get free and instant access.