Insights into a “Remarkable” NASDAQ Development
Here’s what usually happens in the stock market when “the troops abandon the generals”
You’ve probably heard the phrase: “Appearances can be deceiving.”
In other words, it’s usually wise to “take a closer look” because the truth may not be obvious.
This applies to various circumstances of life — even the stock market.
For example, consider this Nov. 19 Reuters headline:
Nasdaq hits fresh record peak …
Of course, the headline appears to support a bullish outlook on the tech-heavy index.
However, after the market close that day, our U.S. Short Term Update showed this chart and said:
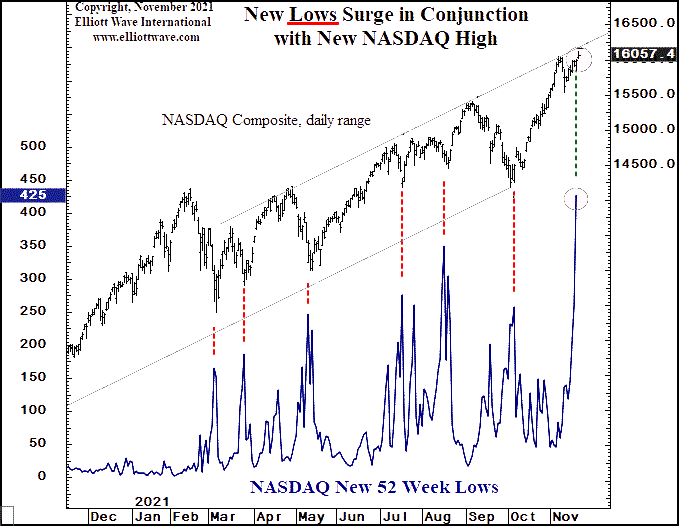
This remarkable chart encapsulates the current state of affairs. The top graph is the NASDAQ Composite from December 2020 and the bottom graph is the daily number of new 52-week lows for the index. Normally, as one would expect, when the NASDAQ declines, the daily number of members that make new 52-week lows increases. Yet, as the NASDAQ was making a new all-time high yesterday (NDX), the number of new 52-week lows surged to 425. This is the highest number of daily new lows since the market meltdown of February-March 2020. It vividly shows how concentrated the stock market rally is, with only a select number of issues pushing the NASDAQ higher. When the troops abandon the generals in the charge up the hill, retreat usually follows. [emphasis added]
The Nov. 21 U.S. Short Term Update followed up by showing this chart and saying:
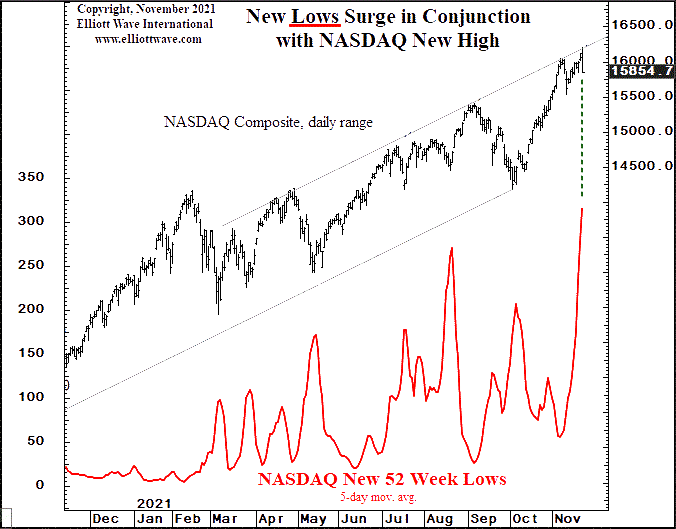
In [the Nov. 19] Update we showed a chart of the extraordinary behavior in the number of 52-week lows on the NASDAQ. As the NASDAQ was in the process of rallying to new highs last week, the number of new 52-week lows outpaced the number of new 52-week highs for five consecutive days. Tonight’s chart shows the same new low data but uses a 5-day average to accentuate the trend. “There’s never been another day when so many stocks fell to new lows as the overall index climbed to a record high” in data going back two decades [referencing Nov. 18].
The new lows surge in conjunction with the NASDAQ’s new high was just one indication that investors should prepare for downside price action.
The Elliott wave model is among the other indications.
Right now, the stock market’s wave structure is sending a clear message that will likely be of high interest to you. Suffice it to say, this message is nothing less than historic.
If you’d like to delve into the details of how the Wave Principle can help you forecast financial markets, you are encouraged to read Frost & Prechter’s Wall Street classic, Elliott Wave Principle: Key to Market Behavior.
Here’s a quote from the book:
After you have acquired an Elliott “touch,” it will be forever with you, just as a child who learns to ride a bicycle never forgets. Thereafter, catching a turn becomes a fairly common experience and not really too difficult. Furthermore, by giving you a feeling of confidence as to where you are in the progress of the market, a knowledge of Elliott can prepare you psychologically for the fluctuating nature of price movement and free you from sharing the widely practiced analytical error of forever projecting today’s trends linearly into the future. Most important, the Wave Principle often indicates in advance the relative magnitude of the next period of market progress or regress. Living in harmony with those trends can make the difference between success and failure in financial affairs.
Good news! You can read the entire online version of Elliott Wave Principle: Key to Market Behavior for free!
All that’s required for free access is a Club EWI membership. Club EWI is the world’s largest Elliott wave educational community and is free to join. Plus, members enjoy complimentary access to a wealth of Elliott wave resources on investing and trading without any obligations.
Follow this link for free and unlimited access to the book: Elliott Wave Principle: Key to Market Behavior.