We will consider three ways to identify price support and resistance in the markets you trade.
- Previous highs and lows
- Trendline support
- Fibonacci Ratios
These examples are adapted from Jeffrey Kennedy’s time tested Trader’s Classroom service.
1) Uptrends terminate at resistance while downtrends terminate at support. Previous highs and lows often act as resistance and support.
In ALCOA Inc (AA), the September 2012 selloff found support near the previous July 2012 low.
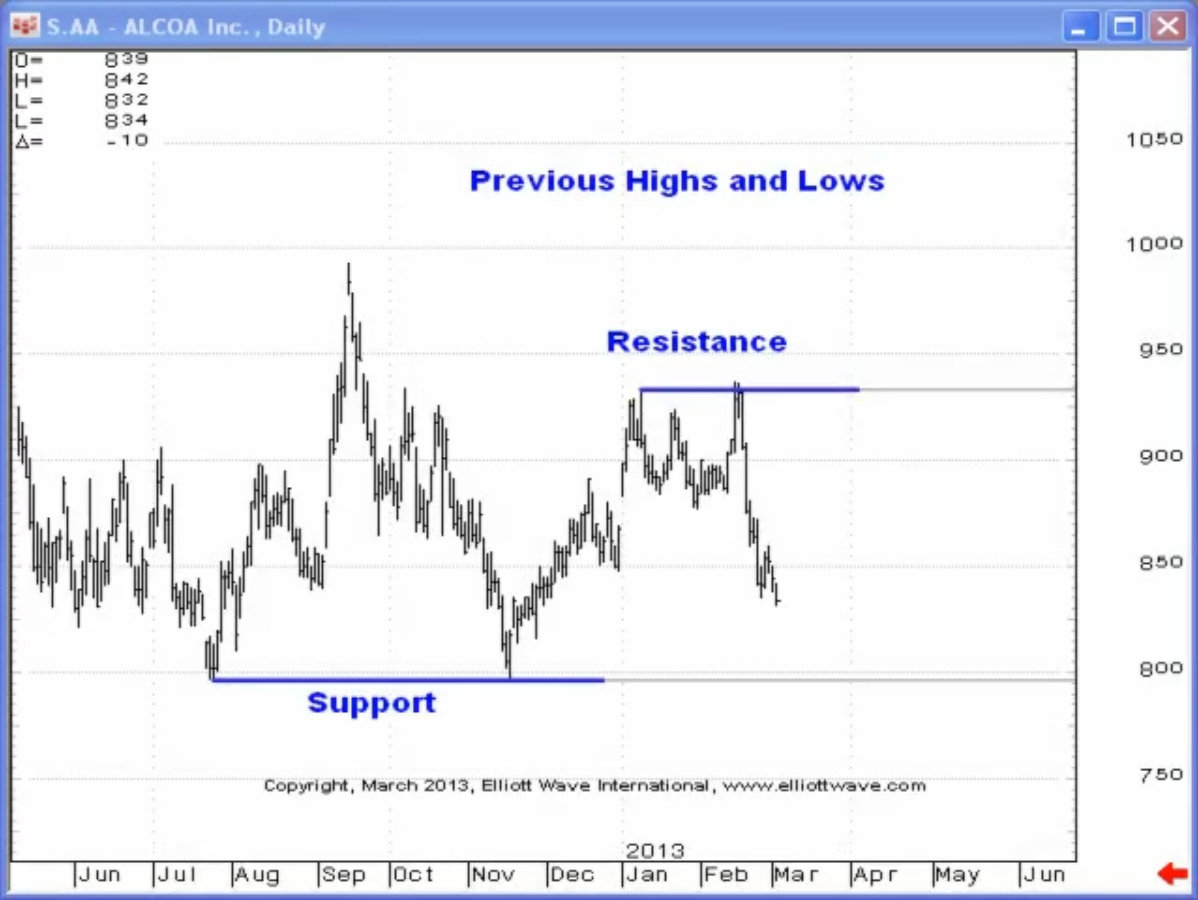
The February 2013 peak occurred following a test of resistance at the January peak at $9.33.
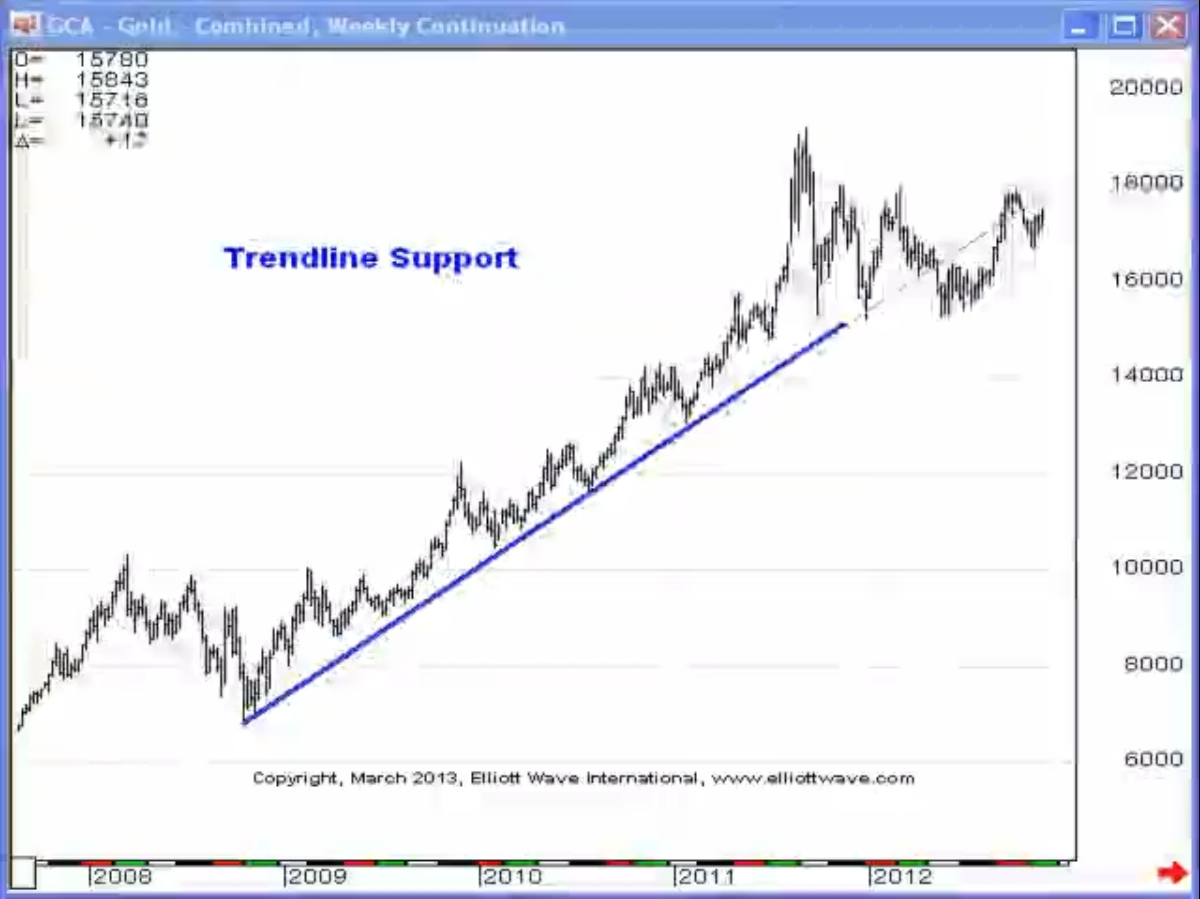
2) Trendlines offer resistance and support for prices.
The 2008 advance in Gold found support numerous times near the trendline that connected the lows of the move, as you can see below:
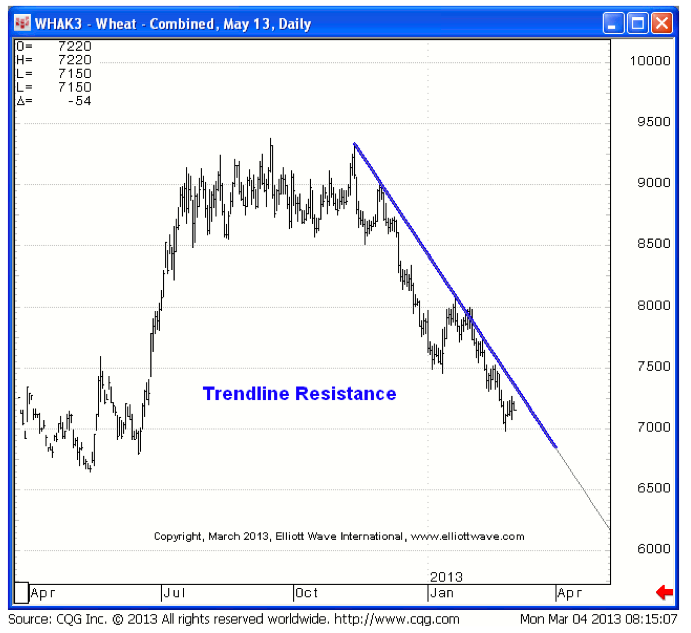
Conversely, the trendline connecting the highs of Wheat’s 2012-2013 decline provided resistance for countertrend price action.
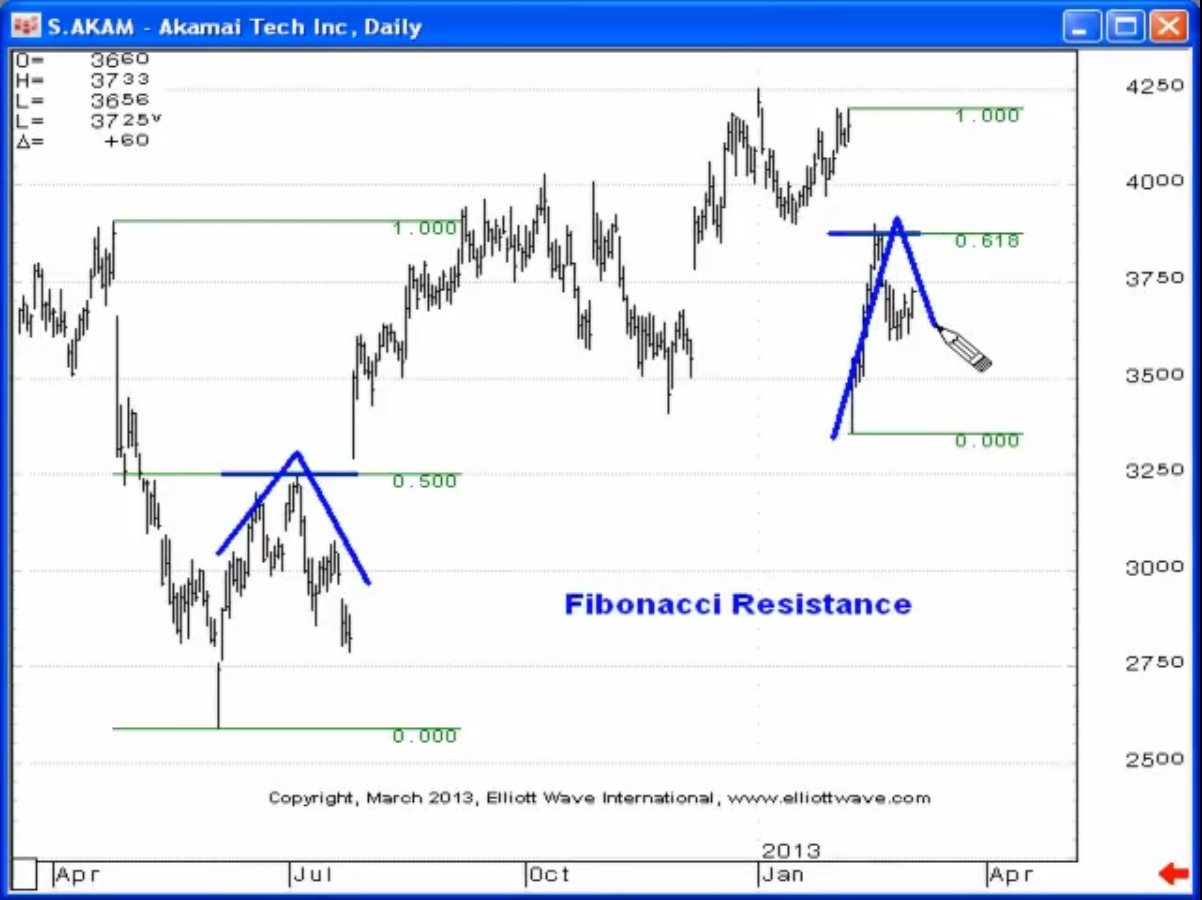
3) Fibonacci ratios also identify resistance and support. As Elliotticians, we often look at retracements, the most common being .382, .500 and .618. In Akamai Tech, Fibonacci support ignited the July and November 2012 rallies:
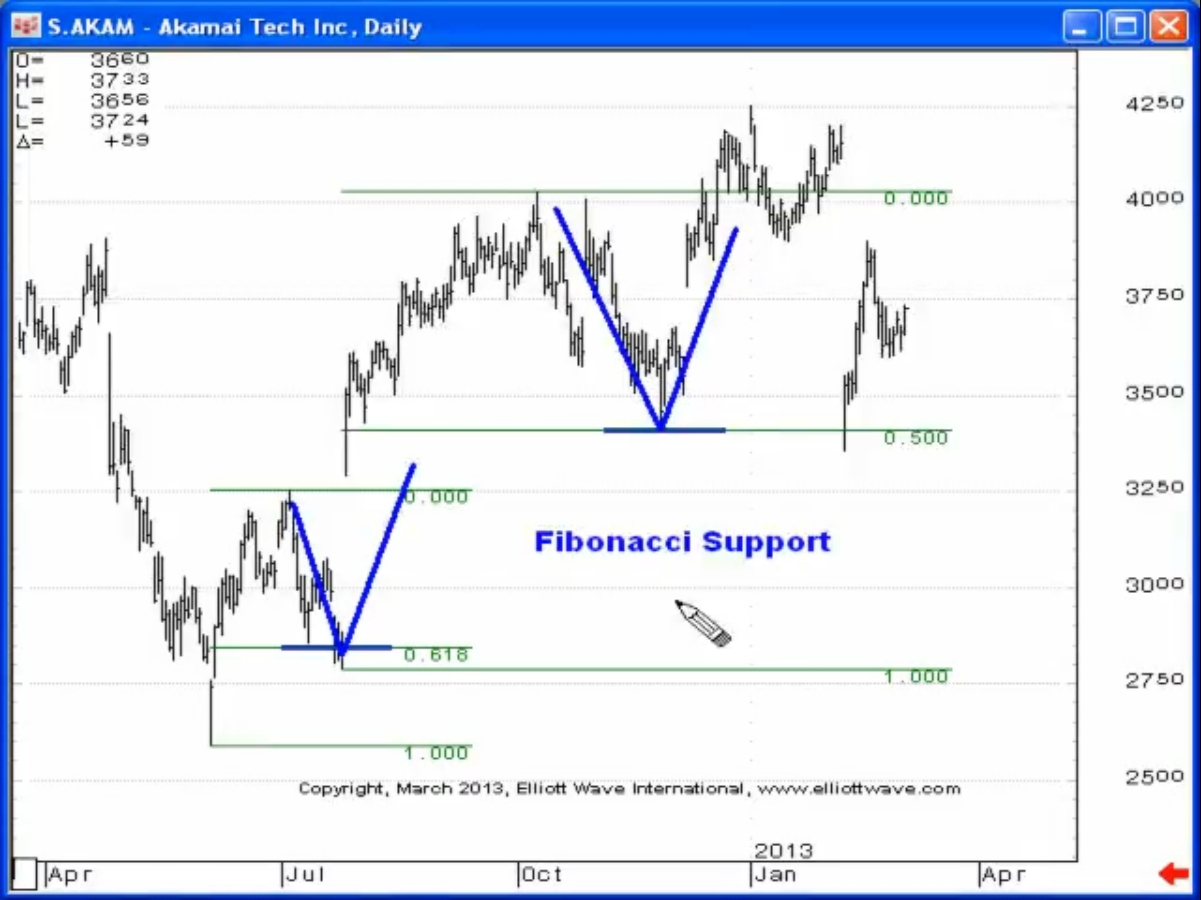
In the same chart you can also notice how Fibonacci resistance in AKAM halted the July 2012 and February advances.
For more free trading lessons on trendlines, download Jeffrey Kennedy’s free 14-page eBook, Trading the Line — 5 Ways You Can Use Trendlines to Improve Your Trading Decisions. It explains the power of simple trendlines, how to draw them, and how to determine when the trend has actually changed. Download free eBook now. We believe this eBook will provide you with a tool set that will improve your success ratio at trading financial markets.