Junk Bonds Are Sending a Signal to Stock Investors
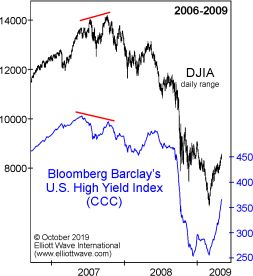
Something happened just before the historic 2007 stock market top — and it’s happening again.
It’s generally known that stocks are risky. It all hinges on how “hungry” investors are.
So, if investors’ appetite for risk starts to diminish, it stands to reason that this is not a positive development for stocks.
But is there a way to gauge investors’ risk tolerance so as to get an early warning sign before stocks start to tank?
Yes, keep your eye on the junk bond market.
You see, junk bonds also carry a great deal of risk because they’re issued by companies with the weakest balance sheets. Investors’ claim on assets in case of bankruptcy is usually next to the bottom rung, just one notch above equity holders. Hence, the trend in junk bonds often aligns with the trend in equities.
Here’s the important point: When the trends of stocks and junk bonds diverge, with stocks holding up as the value of junk debt declines, it’s usually a sign of impending trouble for stocks.
A past Elliott Wave Financial Forecast, a monthly publication which provides coverage of major U.S. financial markets, showed a historical example of such a divergence and said:

A countertrend rally high in prices for high-yield bonds occurred in February 2007, three months before the intraday extreme in the financials, five months before a top in the Dow Jones Composite Average and eight months before a top in the Dow Industrials. All stock indexes then crashed into the first quarter of 2009.
Now, here’s what you need to know in these closing weeks of 2021: Another divergence has been shaping up between high-yield (or “junk”) bonds and stocks.
Indeed, the Nov. 15 U.S. Short Term Update, an Elliott Wave International thrice weekly publication which offers near-term forecasts for key U.S. financial markets, explains why …
… the tension created by the nearly two-month non-confirmation between HYG [a junk bond ETF] and the Dow is about to become more severe.
Plus, the message of the Elliott wave model regarding the stock market is also revealing.
If you’re new to Elliott wave analysis, here’s a quote from Frost & Prechter’s Wall Street classic, Elliott Wave Principle: Key to Market Behavior:
In the 1930s, Ralph Nelson Elliott discovered that stock market prices trend and reverse in recognizable patterns. The patterns he discerned are repetitive in form but not necessarily in time or amplitude. Elliott isolated five such patterns, or “waves,” that recur in market price data. He named, defined and illustrated these patterns and their variations. He then described how they link together to form larger versions of themselves, how they in turn link to form the same patterns of the next larger size, and so on, producing a structured progression. He called this phenomenon The Wave Principle.
Although it is the best forecasting tool in existence, the Wave Principle is not primarily a forecasting tool; it is a detailed description of how markets behave. Nevertheless, that description does impart an immense amount of knowledge about the market’s position within the behavioral continuum and therefore about its probable ensuing path. The primary value of the Wave Principle is that it provides a context for market analysis.
If you’d like to learn more about the Wave Principle, there’s a way to read the entire online version of the book for free.
That “way” is to become a Club EWI member. Club EWI is the world’s largest Elliott wave educational community and membership is free. Plus, members enjoy free access to a wealth of Elliott wave resources on financial markets, investing and trading with zero obligations.
Just follow this link to get started: Elliott Wave Principle: Key to Market Behavior — free and unlimited access.