Robert Prechter on Herding and Markets’ “Irony and Paradox”
To anyone new to socionomics, the stock market is saturated with paradox.
The following is an excerpt from a classic issue of Robert Prechter’s Elliott Wave Theorist. For a limited time, you can visit Elliott Wave International to download the rest of the 10-page issue free.
Market Herding
Have you ever watched a dog interact with its owner? The dog repeatedly looks at the owner, taking cues constantly. The owner is the leader, and the dog is a pack animal alert for every cue of what the owner wants it to do. Participants in the stock market are doing something similar. They constantly watch their fellows, alert for every clue of what they will do next. The difference is that there is no leader. The crowd is the perceived leader, but it comprises nothing but followers. When there is no leader to set the course, the herd cues only off itself, making the mood of the herd the only factor directing its actions.
Irony and Paradox
To anyone not versed in socionomics, everything the stock market does is saturated with paradox.
— When T-bills sported double-digit interest rates in 1979-1984, investors saw no reason to abandon their T-bills for stocks; when T-bill rates were low in the 2000s, investors saw no reason to put up with the “low yield” of T-bills and sought capital gains in stocks. The first period was the greatest stock-buying opportunity in two generations, and the second period was the greatest stock-selling opportunity ever.
— When long-term bonds yielded 15 percent in 1981, investors were afraid of Treasury bonds even though they were about to embark on the greatest bull market ever; in December 2008, when the Fed pledged to buy T-bonds, rising prices appeared so strongly guaranteed that the Daily Sentiment Index indicated a record 99 percent bulls, just before prices started to fall.
— When oil was $10.35 a barrel in 1998, no one made a case that the world was running out of black gold; but when it was 7-8 times more expensive, some three dozen books came out arguing that global oil production had peaked, a theme that convinced investors to begin buying oil futures…about a year before the price collapsed 78 percent.
— In the second half of the 1990s, the idea that stocks would always be the best investment “in the long run” became popular just as a long period of superior returns was coming to an ignoble end. A new study… shows that as of today the S&P has underperformed safe, boring Treasury bonds for the past 40 years, since 1969.
— Just when nearly everyone — including world-famous investors — finally panicked and conceded in February-March 2009 that the financial and economic worlds were in dire shape, the market turned around and shot upward in its fastest rally in 76 years.
And so on. The exogenous-cause model fools investors exquisitely. One reason is that rationalization follows upon mood change. Mood change comes first, and attempts at reasoning come afterward. Socionomists recognize that social mood is primary and has consequences in social action, so we never have to wrestle with paradox. This orientation does not mean that we are always right. It means only that we are not doomed to be chronically wrong.
To succeed in the market, you must learn initially to embrace irony and paradox, at least as humans are unconsciously wired to interpret things. Once you get used to the world of socionomic causality, the irony and paradox melt away, and everything makes perfect sense…
Read the rest of this classic Elliott Wave Theorist issue now, free! You’ll get 10 pages of Bob Prechter’s unique insights on:
- Why Finance and Macroeconomics Are Not Subsets of Economics
- How Correct Are Economists Who Forecast Macroeconomic Trends?
- The “Beat the Market” Fallacy
- Stock-Picking Geniuses or Just a Bull Market?
- Index Funds and Diversification
- Market Confidence vs. Certainty
- Observations on Corporate Earnings
- Why Being a Bear Doesn’t Equal “Doom & Gloom”
- More
Visit Elliott Wave International to download your free 10-page issue.
Most investors act as a herd when it comes to investment decisions. The herd is right in the middle of a long running trend, but they usually miss the early gains and end up running off the cliff at the top and end up holding the bag with disasterous losses as the market declines. What is an individual investor to do? One thing we can do is to avoid being part of the herd and to do that we need to recognize where we are in the broader trend. Elliot wave theory helps us map the stock market moves using price charts and technical analysis.
Trading and Investing Using the Elliott Wave Theory
The question: Why use the Wave Principle when trading or investing?
The answer: To avoid the herd that usually loses money in the markets.
The explanation: Herding makes it difficult to follow the most useful trading advice to buy low and sell high. More often than not, what really happens is that you hear about a stock or an index and decide to buy it because it’s in the news. Why is it in the news? Usually because the price has been going higher. Lots of people in the financial media say that it’s doing well, so you decide to “get in now” — even though you know the shares are not at a low. After all, why would people talk up the stock if it were headed down? And you wouldn’t really want to buy a stock other people were selling … would you?
Once you buy, one of these three things usually happens:
- The stock or index continues up for a brief time. You manage to hold on until just after it turns down, and sell so that you get out near the top. (You didn’t buy low, but you sold it for more than you paid and made some money.)
- It goes up and then down, and then up and down again — and again — while you agonize. You read whatever you can find to help decide whether to stay in or get out. You finally get out about where you got in. (You neither bought low nor sold high, nor did you make any money.)
- It turns down after you purchase it. And it keeps drifting down until you can’t stand it anymore. So you sell. (You bought high and sold low; depending on how long you held it, you lost a little or a lot of money.)
The outcome: Either you win small, you come out even (except for brokerage fees), or you lose either big or small. What happened to the simple and elegant idea of buying low and selling high? Well, that idea vanished in the labyrinth of your quickly turning, emotional mind. When it comes to real-time decisions, it seems nearly impossible to do what you know you should to do to make the most money. The irrational mind beats out the rational mind. Welcome to the world of herding.
The better way to do it: The Wave Principle, on the other hand, provides rules and guidelines to help you avoid the herd of investors, particularly as they react to the latest news. You can see patterns in price charts and decide when a market may be about to turn up or down; you can also plan when to trade or invest with some objectivity.
If you would like to get the full story on why it’s worthwhile using the Wave Principle to trade and invest, then watch the first video in the Elliott Wave Crash Course “Why Use the Wave Principle?”
How to view the video: All you need to do is become a member of Club EWI. There is no cost, and there aren’t any strings attached. Check it out now: Why Use the Wave Principle?
Elliott Wave International’s educational guru, Wayne Gorman, explains it this way in the Elliott Wave Crash Course:
- “The process is being driven by an emotional, unconscious response by investors who look at the market subjectively and impulsively and who must make decisions under conditions of ignorance and uncertainty.… Most people tend to engage in what we call herding. They follow the actions of others, whether those others are on the right side of the market or not.
- “The result is that prices move up and down according to investors’ optimism and pessimism. Investors use the news to rationalize their emotional decisions, and most people lose money.”
Even the big boys do it. Stock mutual funds tout their investing know-how, yet this chart shows that they also succumb to buying at tops when prices are high and selling at lows. It compares 40 years of the S&P 500’s price moves with the changes in stock mutual funds’ cash vs. assets ratio. When the percentage of cash is low, it means that the funds are buying stocks and keeping less cash (marked as “Bought” on the chart). When the percentage of cash is high, they are selling stocks and converting to cash (marked as “Sold” on the chart).
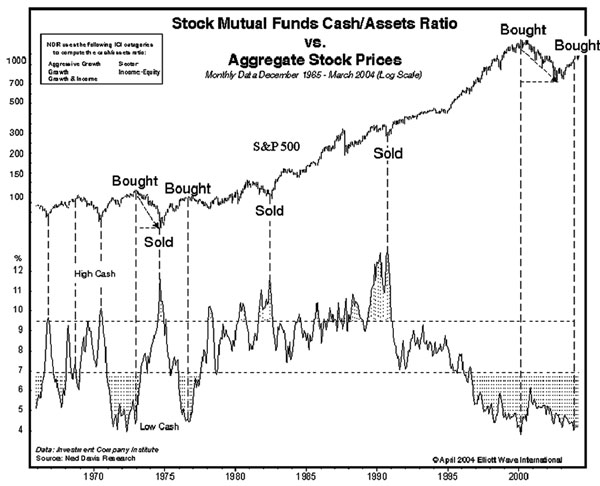 |
Gorman again: “Notice that funds are heavily invested in stocks at top of markets and little invested in stocks at major bottom. This pattern tends to repeat itself over time — and results in losses.”
Learn more on how to use Elliott Wave principle – Check it out now: Why Use the Wave Principle?