The “Trump Bump” Was in the Cards LONG Before Trump
How to breach limitations of conventional market forecasting
Get the Free Elliott Wave Tutorial
Learn how you can apply the Wave Principle to improve your trading and investing in this free 10-lesson tutorial. You’ll learn:
- What the basic Elliott wave progression looks like
- Difference between impulsive and corrective waves
- How to estimate the length of waves
- How Fibonacci numbers fit into wave analysis
- Practical application tips for the method
It’s been a tough time for the stock market bears.
You just have to look at these recent headlines:
- U.S. stock futures hit fresh highs (Marketwatch, Feb. 20)
- Stocks post best winning streak in 25 years (CNN Money, Feb. 16)
- Stocks Continue Record-Breaking Run (Nasdaq.com, Feb. 15)
As a result, a prominent Canadian market participant has thrown in the towel (zerohedge.com, Feb. 17):
The CEO of Fairfax Financial … announced that he is covering his firm’s equity hedges after suffering a $1.1 billion net loss on its investments in Q4, and $1.2 billion for all of 2016.
But the financial pain hardly ends there. Look at this chart with comments from the Wall Street Journal (Feb. 16):
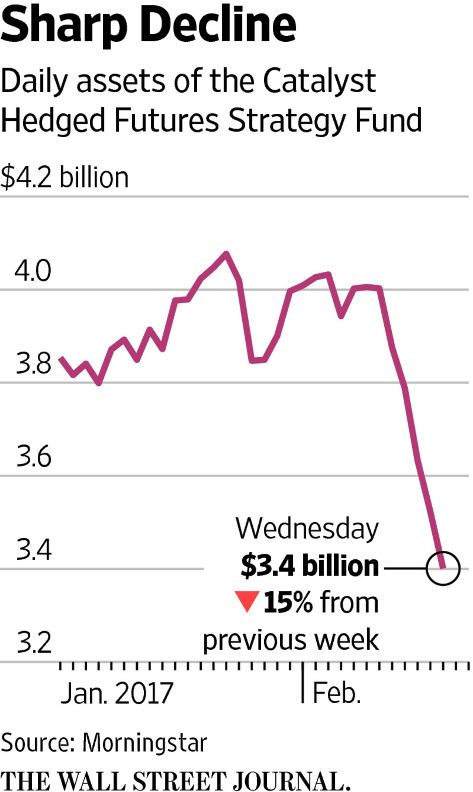
It is the buzz of Wall Street: a five-day, 15% plunge in a U.S. mutual fund whose bearish bets were undone by the S&P 500’s latest run to fresh records.
Many market commentators say stocks have been rising because of the new administration’s policies (Yahoo Finance, Feb. 20):
Much of the post-US election rally in the stock market has been attributed to President Donald Trump’s promises for tax cuts and deregulation.
But long before the election, Elliott wave price patterns already told our subscribers to prepare for a market rally.
Our just-published February Elliott Wave Theorist reviews several charts we published early in 2016. Here’s one of those charts along with commentary from the new Elliott Wave Theorist:
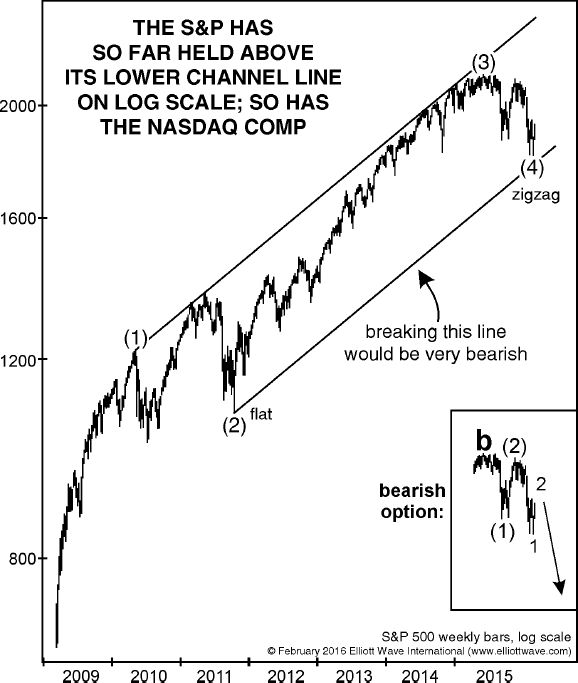
The January and February 2016 issues of The Elliott Wave Theorist, written as stocks were plunging in highly volatile fashion, called for a bottom and labeled the stock indexes as having finished A, B and C of wave (4), a corrective formation dating back to the high of 2015.
In other words, our analysis revealed that the market was starting the next leg up.
Get the Free Elliott Wave TutorialLearn how you can apply the Wave Principle to improve your trading and investing in this free 10-lesson tutorial. You’ll learn:
|
This article was syndicated by Elliott Wave International and was originally published under the headline The “Trump Bump” Was in the Cards LONG Before Trump. EWI is the world’s largest market forecasting firm. Its staff of full-time analysts led by Chartered Market Technician Robert Prechter provides 24-hour-a-day market analysis to institutional and private investors around the world.