Have We Seen The Stock Market Bottom?
Stock market has rallied from the March lows as predicted, but is it a new bull market, or is it a bear market rally? Elliott Wave International has made intensive research to identify the economic and technical indicators that signal a market bottom. And no, we have not seen it yet.
Here is Bob Prechter, in a recent Bloomberg interview describing the market’s overbought condition.
Prechter has recommended a short at 2007 top, and covered days before March bottom. He predicted a rally that would take DOW to 9000 – 10000 range. Now he thinks the stock market rally is on borrowed time.
Prechter’s book “Conquer the Crash” explains the normal valuations that typically appear at major market bottoms. It also explains what a market top looks like. It is a must read to understand how bubbles form and how they burst. To understand the big picture, please read below his insightful explanation about how big the stock bubble is.
Two Unique Charts Reveal the Answer
Robert Prechter, New York Times best-selling author and renowned market analyst, was recently asked to present his thoughts on the real estate market and the financial crisis to the Georgia Legislature. The following article has been adapted from the transcript. Elliott Wave International has made the full presentation available free, including the full transcript and 30-minute online video.
By Robert Prechter, CMT
I’d like to try to answer a question: “Are we near a low in the stock decline?” Because in these times when stocks and real estate are declining together, they tend to bottom roughly together as well. So I want to take a minute and look at a valuation chart for the stock market.
 |
What we have here on the “X” axis is the bond yield/stock yield ratio for the S&P 400 companies. Sounds fancy, but all it means is that the further you go out to the right, the less companies are paying in dividends compared to what they are paying on their IOUs—on their bonds. On the “Y” axis we have stock prices relative to book value. Book value is roughly equivalent to liquidation value, in other words, if you went and sold all the assets on the open market. When stocks get expensive, prices tend to rise relative to book value, and dividends tend to fall relative to the cost of borrowing. Why does that happen? At such times, people don’t really care about dividends because they think they are going to get rich on capital gains. So dividend payout falls, and stocks get more expensive.
The small square boxes indicate year-end figures. The large box is a general area that has contained values for the stock market for most of the years of the 20th century. We had a few outliers: 1928 and August 1987, which preceded crashes in the stock market. And of course stocks were really cheap in the early ’30s and again in 1941. If you are really astute, you have noticed something about this chart, which is that I’ve left off some of the data. It ends in 1990. What happened in the past two decades? Now I’m going to show you same chart but with the data from the last two decades on it. The March 2000 reading we call Pluto. Real estate wasn’t so bad; I think it only got to about Neptune. But the stock market reached Pluto in March of 2000 in terms of the bond yield/stock yield ratio and the price multiple of the underlying values of companies. That’s going to take quite awhile to retrace.
I’ve also plotted the reading for November 2008. The market has made quite a trek back toward normal valuations, but if you look at these multiples in terms of book value, we are at 4 times. It has to go down to 2 times to get back into the box, and we are getting there on the bond yield/stock yield ratio which means that the dividend payout is rising somewhat to catch up with borrowing costs. And because the S&P is down 45%, of course, the dividend payout as a percentage has gone up. But there is a problem there. If you’re reading the newspapers, you know that companies have been cutting dividends. In fact, they’ve been cutting them at the fastest rate in half a century. So it is going to be difficult for values to get back to a normal valuation range. So the stock market has quite a bit lower to go in order to catch up with normal values, and this suggests that real estate may have the same sort of trend going on.
For more information, access Robert Prechter’s full presentation to the Georgia Legislature, free from Elliott Wave International. It expands on the excerpt above with the full transcript, a 30- minute online video, and 12 additional charts and figures.
The Bear Market in Stocks: How Close to the Bottom?
Stock market had a recent decline and many investors and traders are wondering: Have we seen the bottom? Is the correction over? Robert Prechter explains why we still have not seen the long term stock market bottom. According to Prechter’s explanation, even March 2009 low is not the real bottom. Prechter shows that true market bottoms have much higher dividend yields. A major decline that is starting starting now is likely to break March 2009 lows and drive to lower prices in the coming years. Keep reading to understand why.
July 12, 2010
By Elliott Wave International
While many people spend time yearning for the financial markets to turn back up, a rare few have looked back in time to compare historical markets with the current situation – and then delivered a clear-eyed view of the future informed by knowledge of the past. One who has is Robert Prechter. When he thinks about markets and wave patterns, he goes back to the 1700s, the 1800s, and – most tellingly for our time now – the early 1900s when the Great Depression weighed down the United States in the late 1920s and early 1930s. With this large wash of history in mind, he is able to explain why he thinks we have a long way to go to get to the bottom of this bear market.
Here is an excerpt from EWI Independent Investor eBook, that answers the question: How close to the bottom are we?
Originally written by Robert Prechter for The Elliott Wave Theorist, January 2009
Some people contact us and say, “People are more bearish than I have ever seen them. This has to be a bottom.” The first half of this statement may well be true for many market observers. If one has been in the market for less than 14 years, one has never seen people this bearish. But market sentiment over those years was a historical anomaly. The annual dividend payout from stocks reached its lowest level ever: less than half the previous record. The P/E ratio reached its highest level ever: double the previous record. The price-to-book value ratio went into the stratosphere, as did the ratio between corporate bond yields and the same corporations’ stock dividend yields.
During nine and a half of those years, from October 1998 to March 2008, optimism dominated so consistently that bulls outnumbered bears among advisors (per the Investors Intelligence polls) for 481 out of 490 weeks. Investors got so used to this period of euphoria and financial excess that they have taken it as the norm.
With that period as a benchmark, the moderate slippage in optimism since 2007 does appear as a severe change. But observe a subtle irony: When commentators agree that investors are too bearish, they say so to justify being bullish. Thus, as part of the crowd, they are still seeking rationalizations for their continued optimism, and one of their best excuses is that everyone else is bearish. This would be reasoning, not rationalization, if it were true.
But is the net reduction in optimism since 2000/2007 in fact enough to indicate a market bottom? For the rest of this issue, we will update the key indicators from Conquer the Crash that so powerfully signaled a historic top in the making. When we are finished, you will know whether or not the market is at bottom.
 |
Figure 1 above shows our picture of Supercycle and Grand Supercycle-degree periods of prosperity and depression. The top formed in the past decade is the biggest since 1720, yet, as you can see, the decline so far is small compared to the three that preceded it. There is a lot more room to go on the downside.
 |
Figure 2 above shows the Dow’s dividend yield. Over the past nine years, it has improved nicely, from 1.3 percent to 3.7 percent, near its level at previous market tops. If companies’ dividends were to stay the same, a 50 percent drop in stock prices from here would bring the Dow’s yield back into the area where it was at the stock market bottoms of 1942, 1949, 1974 and 1982. But of course, dividends will not stay the same.
Companies are cutting dividends and will cut more as the depression deepens. So, the falling stock market is chasing an elusive quarry in the form of an attractive dividend yield. This is a downward spiral that will not end until prices get ahead of dividend cuts and the Dow’s dividend yield goes above that of 1932, which was 17 percent (or until dividends fall so close to zero that the yield is meaningless).
Get the whole story about how much farther we have to go to a bear-market bottom by reading the rest of this article from EWI’s Independent Investor eBook. The fastest way to read it AND the six new chapters of EWI’s Independent Investor eBook is to become a member of Club EWI.
This article -you just read- was syndicated by Elliott Wave International. EWI is the world’s largest market forecasting firm. Its staff of full-time analysts lead by Chartered Market Technician Robert Prechter provides 24-hour-a-day market analysis to institutional and private investors around the world.
March – 2015 Update on Stock Market Bubble
January 2015 Elliott Wave Theorist urges caution with this single chart of the S&P 500’s year-end valuations since 1927. Every major peak of the last 90 years landed well outside the normal range: 1929, 1987, 2000, and 2007.
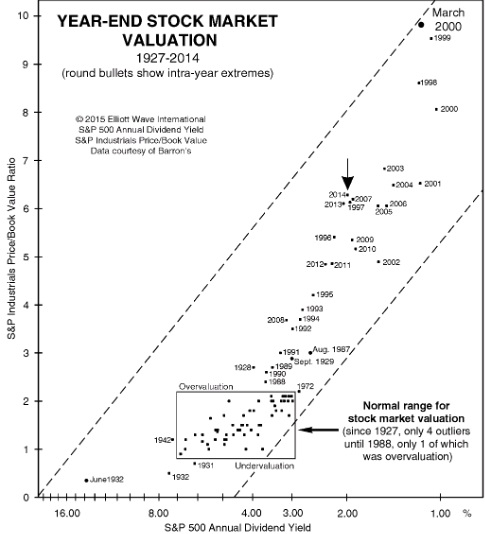
We believe the precarious placement of 2014 sends a similar message: “The stock market and the economy are not in a new multi-decade recovery as economists believe, but very late in a transition phase from boom to bust.”