How To Recognize a Financial Mania When You’re Smack Dab in the Middle of One
When you’re caught in the middle of a bad storm, you don’t really care whether it’s a tropical depression or a full-strength hurricane. You just know you’re hanging on for dear life. The same idea applies to financial markets. When a market is trending up strongly, it’s hard to tell whether it’s just a bull market or a more dangerous financial mania.
The recent tremendous ride up for global and U.S. financial markets, including the Dow, looks and feels more like a mania than a mere bull, says Elliott Wave International analyst Peter Kendall. This distinction is important to recognize in the rising stage, because manias always result in a crash that takes them back beneath their starting point.
Kendall recently published his research into current financial manias throughout the world in SFO (Stocks, Futures and Options) magazine. The article, titled “Financial Manias and the Trade of a Lifetime,” suggests an even more stunning finish for the current manias: “The speed and global scope of the unfolding credit crisis suggest that most of the fast-rising markets of the last decade will crash in unison,” he writes.
Editor’s note: Elliott Wave International invites you to read the full five-page article with charts from the October 2007 SFO magazine by Elliott Wave International’s Pete Kendall called “Financial Manias and the Trade of a Lifetime.”
As co-editor of The Elliott Wave Financial Forecast, Kendall searches for trends that help traders to move in and out of markets. By comparing other historic manias with the impressive rise of the DJIA since the late 1970s, he focuses on the skyscraper pattern that they all have in common. The four historical manias are the Dutch Tulip mania of the 1630s, the South Sea bubble of 1720, the U.S. stock crash of 1921-1932 and the dot.com bust of the 1990s and early 2000s. Once you can see the similarities, you will be better prepared to face the music when the crash comes. As Kendall writes, “once the belief that the markets will always rise becomes widespread, it actually signals the start of a price swing that tends to be a career-breaker for any trader who tries to oppose it.”
He also discusses current manias, such as the Nikkei, which has yet to return to its start after a manic rise to its all-time high in December 1989, and the Dow, which reversed from its rise in 2000 but made a U-turn in 2002. The starting point for the Dow’s mania as shown in the chart included in the article is at the 1000 level.
Kendall, who is also writing a book about financial manias, titled The Mania Chronicles, describes five telltale signs that help an investor to tell the difference between a regular bull market and a mania. It’s a mania if:
- 1. There is no upside resistance, and rising prices seem to be perpetual.
2. Everyone in the market looks like an expert.
3. There is a flight from quality investments to riskier investments.
4. As financial bubbles pop in one area, they bubble up in others.
5. The crash after the peak takes back all the gains the mania made.
- No. 5 can be viewed only with hindsight. But the first four signs provide essential clues to what’s shaping up in the markets.
- “By studying past mania experiences, traders can gain valuable insight into the collective emotions that drive their markets,” writes Kendall. “It’s possible to make significant money in the advancing stages of a mania with no knowledge of its existence. But there is nothing like recognizing a mania for what it is in real time to help a trader keep those gains and deal with the relentless crash after it peaks.”
- In the last part of the SFO article, he asks the key question, Are we at the peak yet? Find out his answer by reading the whole article for yourself.
Susan C. Walker writes for Elliott Wave International, a market forecasting and technical analysis company. She has been an associate editor with Inc. magazine, a newspaper writer and editor, an investor relations executive and a speechwriter for the Federal Reserve Bank of Atlanta. Her columns also appear regularly on FoxNews.com.
Addendum to this topic:
Finance’s Euphoria: The Epilogue
What Record High Dollar Volume of Trading Says About Confidence
November 6, 2009
The following article was adapted from the November 2009 Elliott Wave Financial Forecast and reprinted with permission here. It shows the extent of theFinancial Mania we are going through. Until Nov. 11, you can read the rest of this brand-new report for free, during Elliott Wave International‘s FreeWeek of U.S. forecasts.
By Steve Hochberg and Pete Kendall
When Wall Street’s total value of assets rose to a “mind-boggling 36.6 percent of GDP” in late 2006, The Elliott Wave Financial Forecast published a chart of U.S. financial assets literally rising off the page.
 |
The Financial Forecast observed that financial engineers had “found a new object of investor affections—themselves” and asserted that “the financial industry’s position so close to the center of the mania can mean only one thing; it is only a matter of time” before a massive reversal grabbed hold. Financial indexes hit their all-time peak within a matter of weeks, in February. The major stock indexes joined the topping process in October 2007 and in December 2007 the economy followed. Subscribers will recall that one of the most important clues to the unfolding disaster was the level of financial exuberance relative to the fundamental economic performance.
This chart of the value of U.S. trading volume (courtesy of Alan Newman at www.cross-currents.net) reveals that the imbalance is far from corrected.
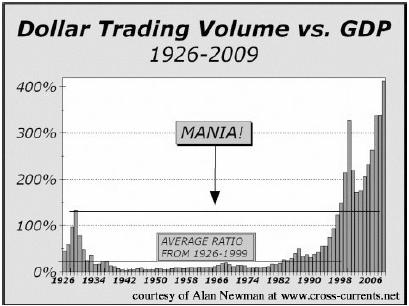 |
Incredibly, total dollar trading volume is even higher now than it was in 2007 when the economy was humming along. In June 2008, dollar trading volume also defied an initial thrust lower in stocks and the economy, eliciting this comment from the Financial Forecast:
- The chart of dollar trading relative to GDP shows how much more willing investors are to trade shares in companies that operate in an economic environment that is anemic compared to that of the mid-1960s. A basic implication of the Wave Principle is that the public will always show up at the end of a rally, just in time to get clobbered. This chart shows that it is happening in a big, big way now because the market is at the precipice of the biggest decline in a long, long time.
Total dollar volume continues to rise despite further fundamental financial deterioration. Yes, GDP experienced a one-quarter, clunker-aided uptick of 3.5 percent in the third quarter. But the economy is in far worse shape than it was when we made the above statement. In fact, its recent performance on top of the decades-long economic underperformance (which is discussed extensively in Chapter 1 and Appendix E of the new edition of Robert Prechter’sConquer the Crash) means that industrial production just experienced its worst decade since 1930-1939. Total manufacturing employment slipped to 11.7 million people, its lowest level since May 1941 when it was 33 percent of all jobs. According to Bianco Research, manufacturing now accounts for only about 9 percent of the workforce. Finance anchors the economy now, which makes it far more susceptible to non-rational dynamics.
As Prechter and Parker explain in “The Financial/Economic Dichotomy” (May 2007, Journal of Behavioral Finance), a financial system is not bound by the laws of supply and demand in the same way that an industrial economy is. In finance, confidence and fear rule decisions. “In the financial context,” say Prechter and Parker, “knowing what you think is not enough; you have to try to guess what everyone else will think.”
We do know one thing: When everyone is thinking the same, the opposite will happen.
Right now, record high dollar volume of trading shows that confidence, at least on this basis, has reached a new historic extreme.
Learn more about Elliott Wave International, and sign up for reports like this here
Steve Hochberg and Pete Kendall are co-editors of the Elliott Wave Financial Forecast.