Does AAPL’s 6% June slide indicate that a top is already in?
On June 29, the Apple iPhone turned 10 years old. But, for many, the mood surrounding the milestone was less than celebratory. Reason being, in June alone, Apple Inc. (AAPL) plunged 6% to two-month lows amidst a broad-scale bruising of the global tech sector.
And so, the cursor on some Smartphone stock trading apps sits there — blinking, blinking, blinking…
What’s the next move? Is AAPL’s 6% sell-off the start of a new downtrend. Or, will prices find a bottom and reclaim the upside?
It’s a simple question. And yet, finding an answer seems so complicated. The mainstream route can be a twisted rabbit hole of conflicting news items, such as these contradictory Apple Inc. outlooks from June 30:
- “It’s time to bet against Apple” (CNBC)
— Versus —
- “Apple Inc. (AAPL) Stock: Still a Strong Buy. Ignore ‘Peak’ Tech” (Investorplace.com)
And, if you’re not careful, the technical route can be just as confusing, leaving your price chart with more horizontal lines (to indicate potential targets) than a sheet of college-ruled paper.
Which brings us to EWI senior analyst Jeffrey Kennedy. In his June 15 Trader’s Classroom video lesson, Jeffrey shows traders a simple and effective strategy for determining how far a counter-trend move will travel — or, if said move marks the beginning of a new trend altogether. The best part is, knowing which scenario is underway comes down to TWO simple price levels:
- Key support/resistance: Where prices will fall/rise to, and then reverse from if the larger trend is incomplete
- Critical support/resistance: Where prices will penetrate if the trend is complete and a top/bottom is in place, thereby invalidating an Elliott wave interpretation
Listen to the following clip from Jeffrey’s June 15 Trader’s Classroom video to hear him explain how this strategy works in real time:
Listen to the following clip from Jeffrey’s June 15 Trader’s Classroom video to hear him explain how this strategy works in real time:
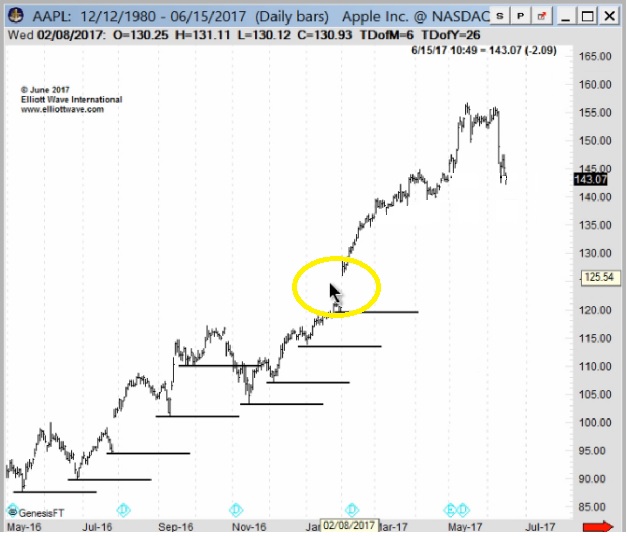
Jeffrey then shows a daily price chart of AAPL, marked by key levels where falling prices consistently dropped to, and reversed from, during the market’s year-long uptrend. He then homes in on the June sell-off to determine its specific Elliott wave structure, labeling it a fourth wave based on two pieces of evidence, see:
An acceleration gap, which “often occur in the wave three position of an impulsive structure.”
And, a decisive upside penetration of a base channel:
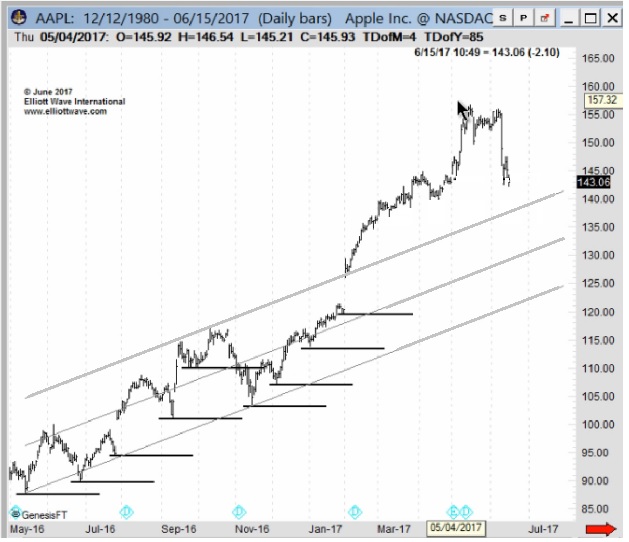
With a potential Elliott wave label in toe, Jeffrey then identifies the key and critical price levels for AAPL’s fourth-wave, June sell-off.
As Jeffrey puts it:
“Traders can utilize this approach on any market and on any time frame.”
He goes on to demonstrate its universal effectiveness in the real-time price action of the Dow Jones Industrial Average and sugar.
Watch Jeffrey’s June 15 Trader’s Classroom video in its entirety to see this simple, yet powerful trading strategy in action.
Announcing Trader Education Week: July 17-19You’ve found a high-confidence trade setup. Now What? Spend this week getting FREE lessons on techniques to enter and exit trades with high confidence — from one of the world’s foremost market technicians, Jeffrey Kennedy. These free lessons will help you understand the necessary steps you should take when a new opportunity presents itself. Register now and get immediate access to your Introductory Resources |